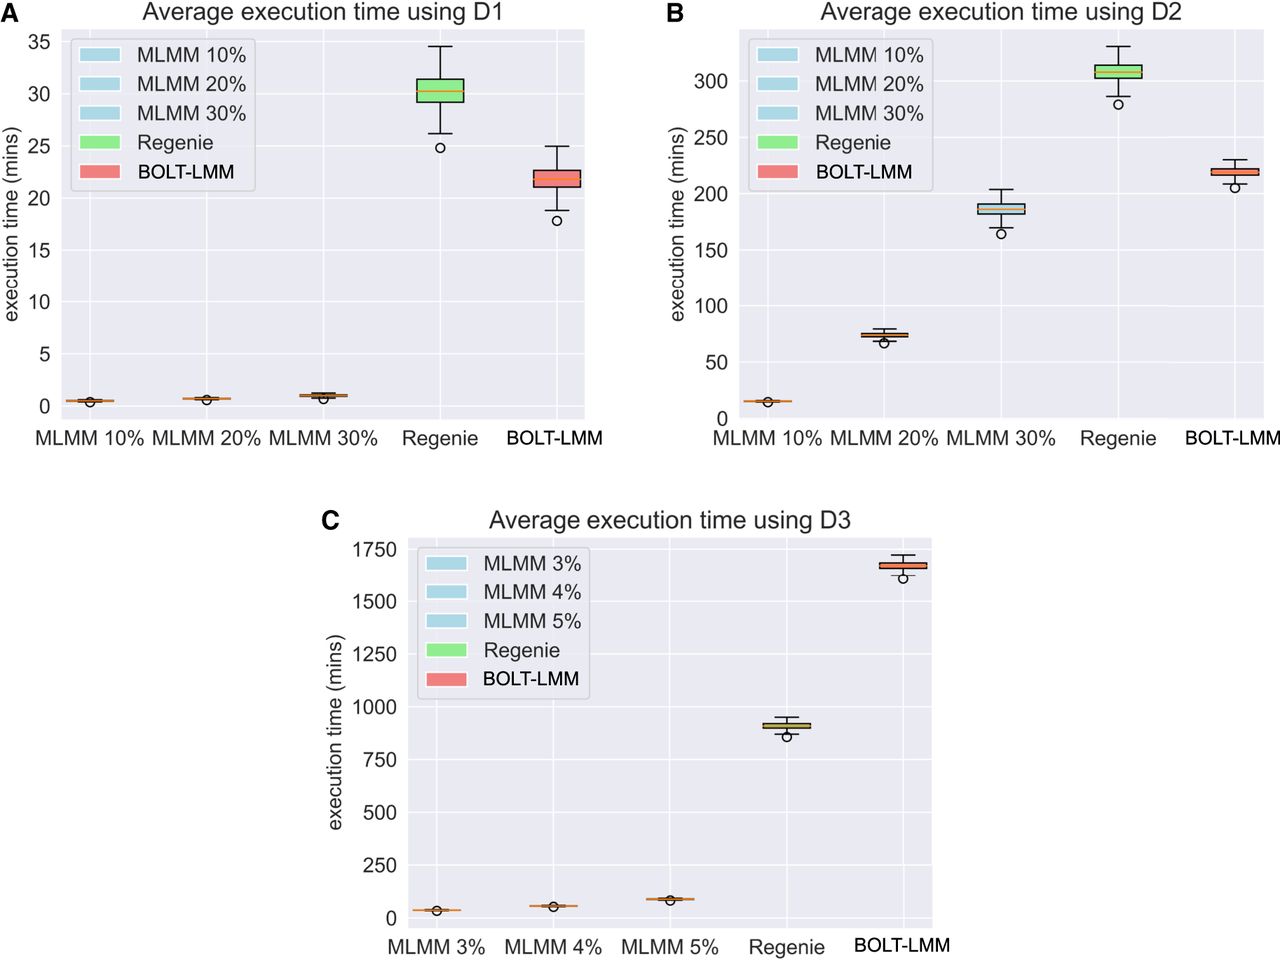
Figure 1.
Box-and-whisker plots of the execution times across 20 identical runs of MaSk-LMM (MLMM), Regenie, and BOLT-LMM when applied to the British–Irish simulated data (265,462 SNPs) with (A) 10,000 samples; (B) 100,000 samples; and (C) 500,000 samples.