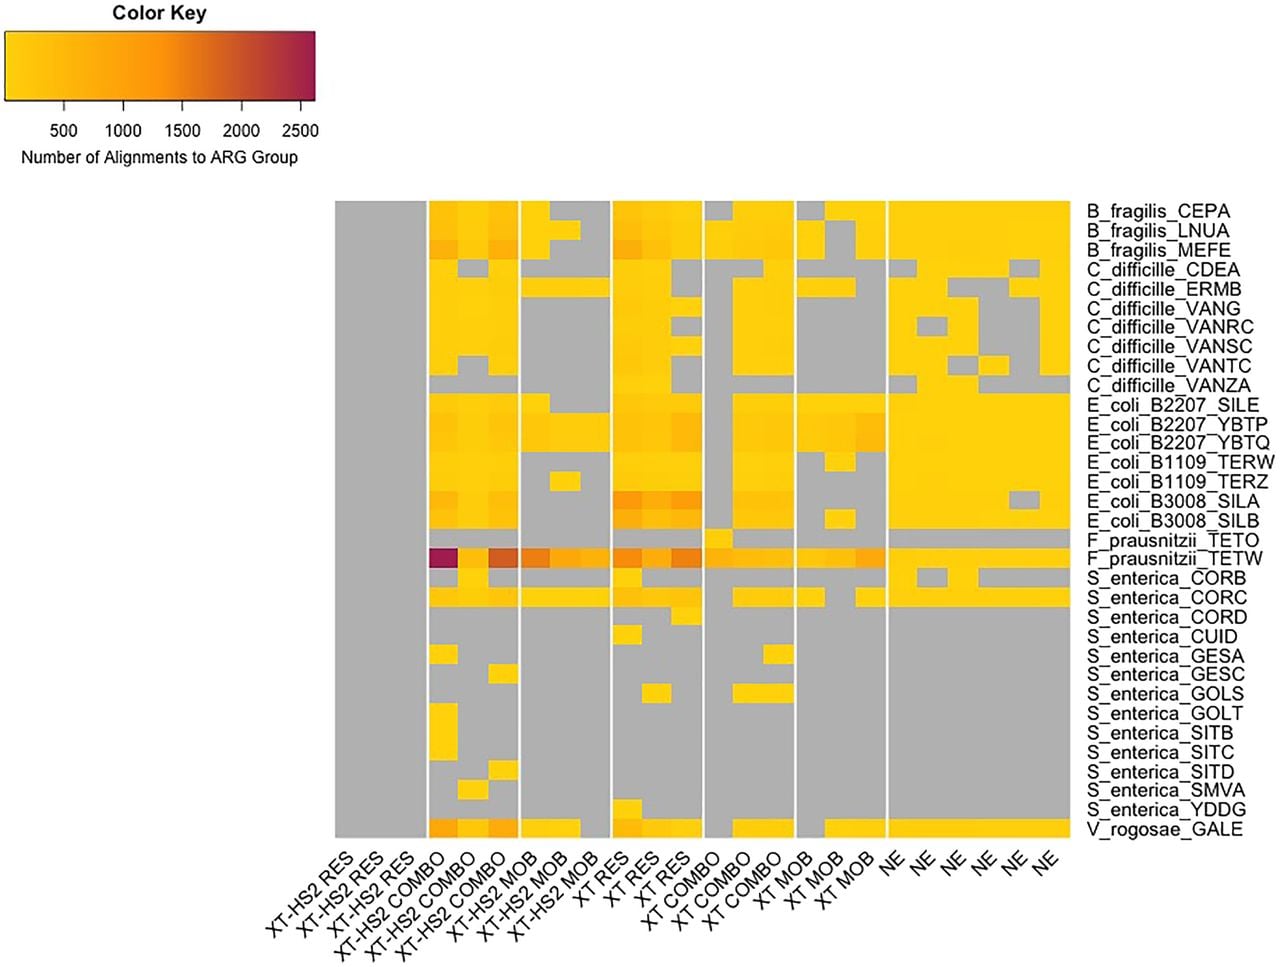
Figure 6.
Heatmap of alignments to GT-ARGs (y-axis), by replicate (x-axis). Replicates are grouped by enrichment protocol and probe set (x-axis), and each GT-ARG is listed along with the bacterial species from which it originated (y-axis). Gray cells indicate GT-ARGs with no alignments in the relevant replicate.