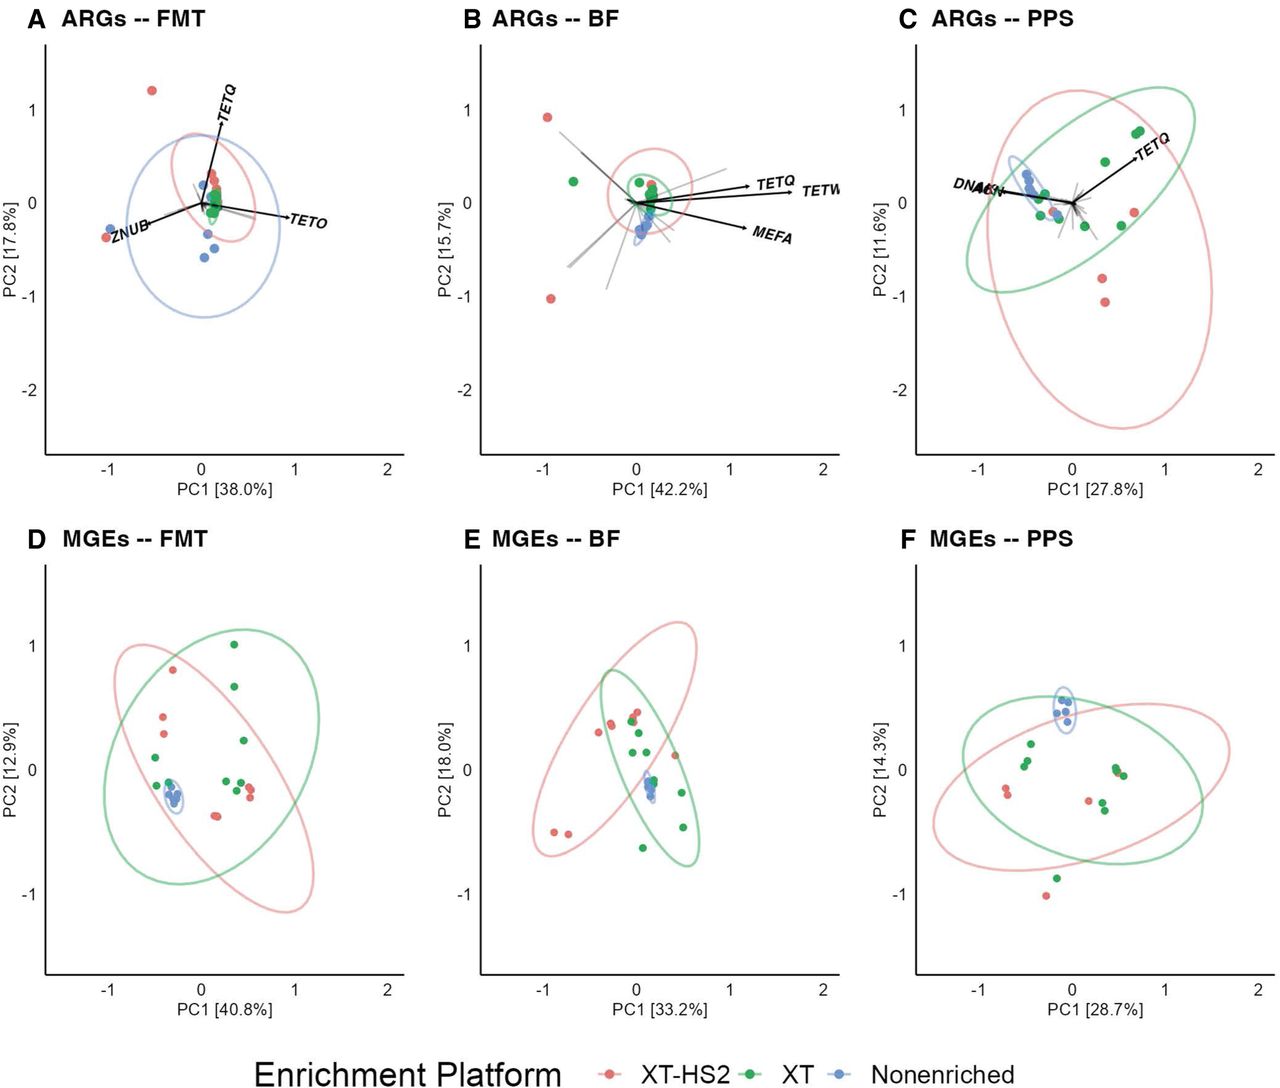
Figure 4.
Resistome and mobilome beta-diversity analysis of Bray–Curtis dissimilarity distances of microbiome samples, including BF, human FMT, and PPS. Group-level ARG and accession-level MGE library compositions are colored by enrichment protocol (XT-HS2 in pink, XT in green, and nonenriched in blue). Arrows in (A–C) indicate the loading vectors for ARG groups. The ARG groups with the longest arrow length are labeled by name.