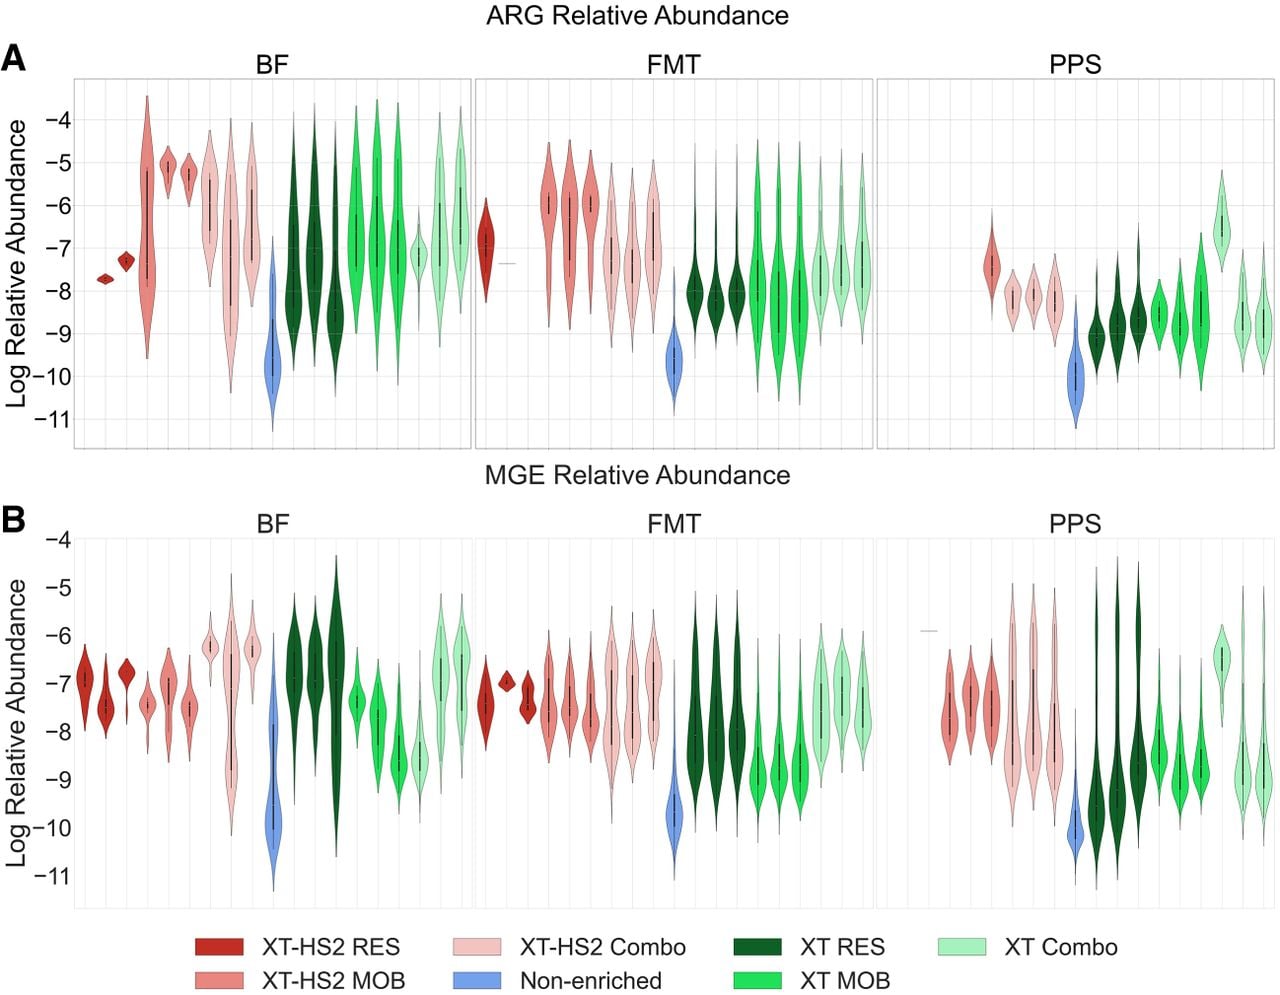
Figure 3.
Violin plots showing the log10 relative abundance of ARG groups (A) and MGE accessions (B) normalized by gene length and sequencing yield, for BF, FMT, and PPS samples, colored by enrichment protocol and probe set. Technical replicates of TELSeq libraries are shown individually, while the 24 nonenriched replicates are summarized into a single violin plot.