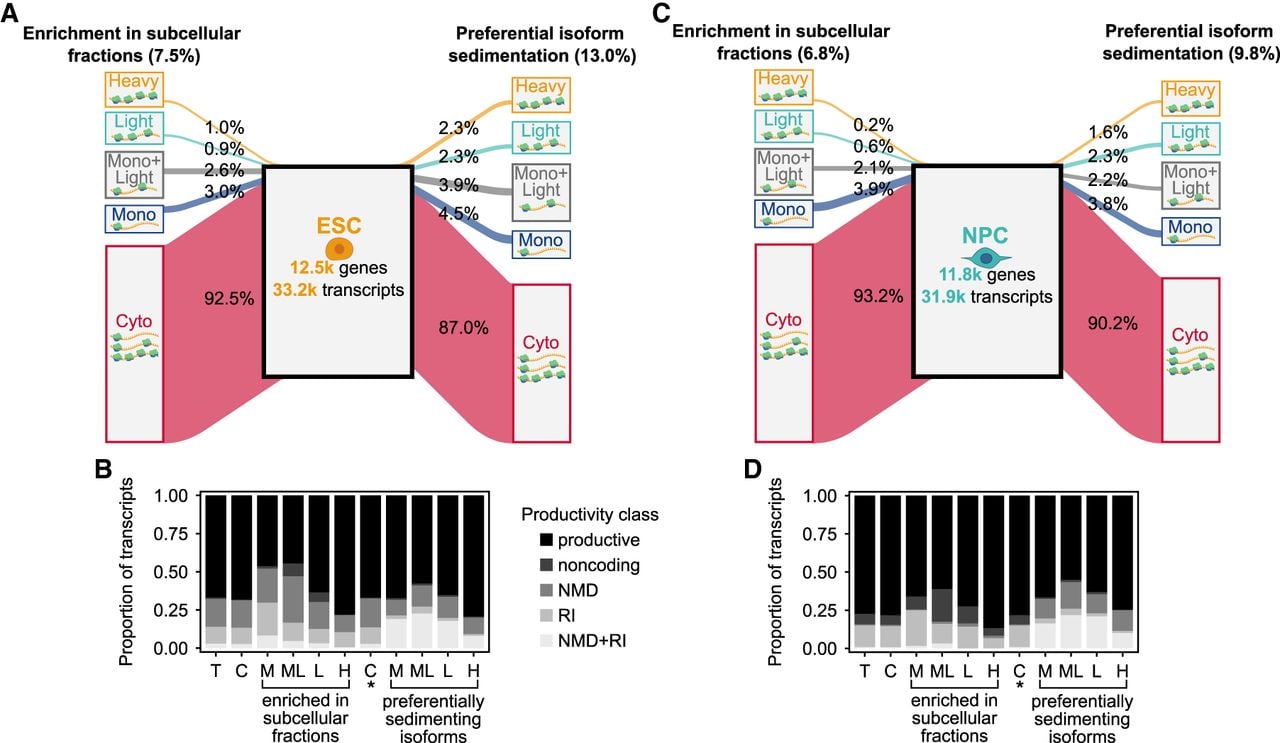
Summary of transcriptomic ribosome association profiles. (A,C) We identified thousands of transcripts in ESC and NPC whose expression was significantly higher (log2FC ≥ 1.0, P-value ≤ 0.05) in a subcellular fraction relative to the cytosol. We also identified thousands of isoforms in multi-isoform genes whose gene fraction was significantly higher (Δ gene fraction ≥ 0.1, Q-value ≤ 0.05) in a subcellular fraction relative to its gene fraction in the cytosol. (B,D) The proportion of productive and unproductive transcript classes in each subpopulation of transcripts enriched and/or preferentially sedimenting in subcellular fractions. (T) Whole expressed transcriptome in the given cell type. Fractions: (C) cytosol, (M) Mono, (ML) Mono + Light, (L) LPR, and (H) HPR. (C*) The subset of transcripts comprising multi-isoform genes specifically, in the cytosol.