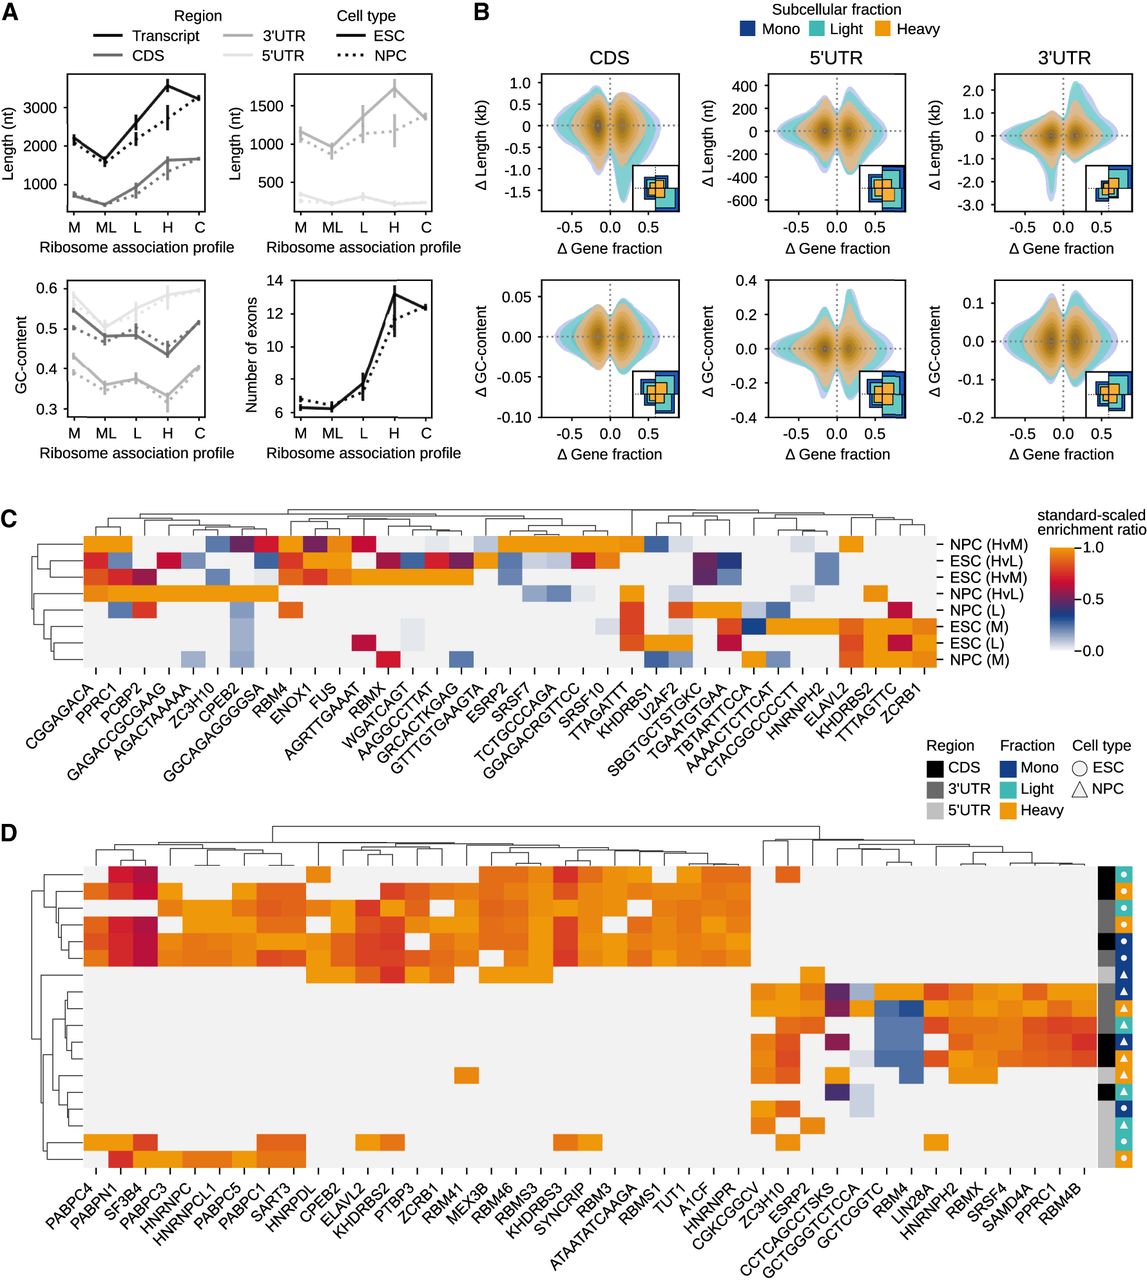
Analysis of features correlated with ribosome association profiles. (A) The number of exons and summaries of length and GC-content, with 90% confidence interval, of the CDS, 5′ UTR and 3′ UTR of transcripts associated with subcellular fractions. Fractions: (C) cytosol, (M) Mono, (ML) Mono + Light, (L) LPR, and (H) HPR. (B) Measurement of the change in isoform gene fraction relative to the cytosol and differences in CDS, 5′ UTR and 3′ UTR length, and GC-content of differentially sedimenting isoforms relative to the dominant isoform in the cytosol. Kernel densities for all coding isoforms are drawn with a 0.2 threshold. Subplots in the bottom left of each plot summarize the relative abundance of observations in each quadrant of their respective main plot, colored by fraction. (C) HOMER-derived de novo sequence motif and known RBP motif enrichment ratios in skipped exons enriched in subcellular fractions versus skipped exons not enriched in each given fraction. “M” and “L” refer to the Mono and LPR-associated FASE sets, whereas “HvM” and “HvL” refer to the HPR-associated FASE sets relative to the Mono and LPR fractions, respectively. (D) Enrichment of motifs using the same approach as in C, but in 30 nt windows of the CDS, 5′ UTR, and 3′ UTR of isoforms exhibiting divergent sedimentation profiles across cell types. The target sets were made from isoforms that preferentially sediment with each given subcellular fraction in one cell type, and the background sets were made from isoforms exhibiting the same in the other cell type. The standard-scaled enrichment ratio colorbar is shared by C and D.