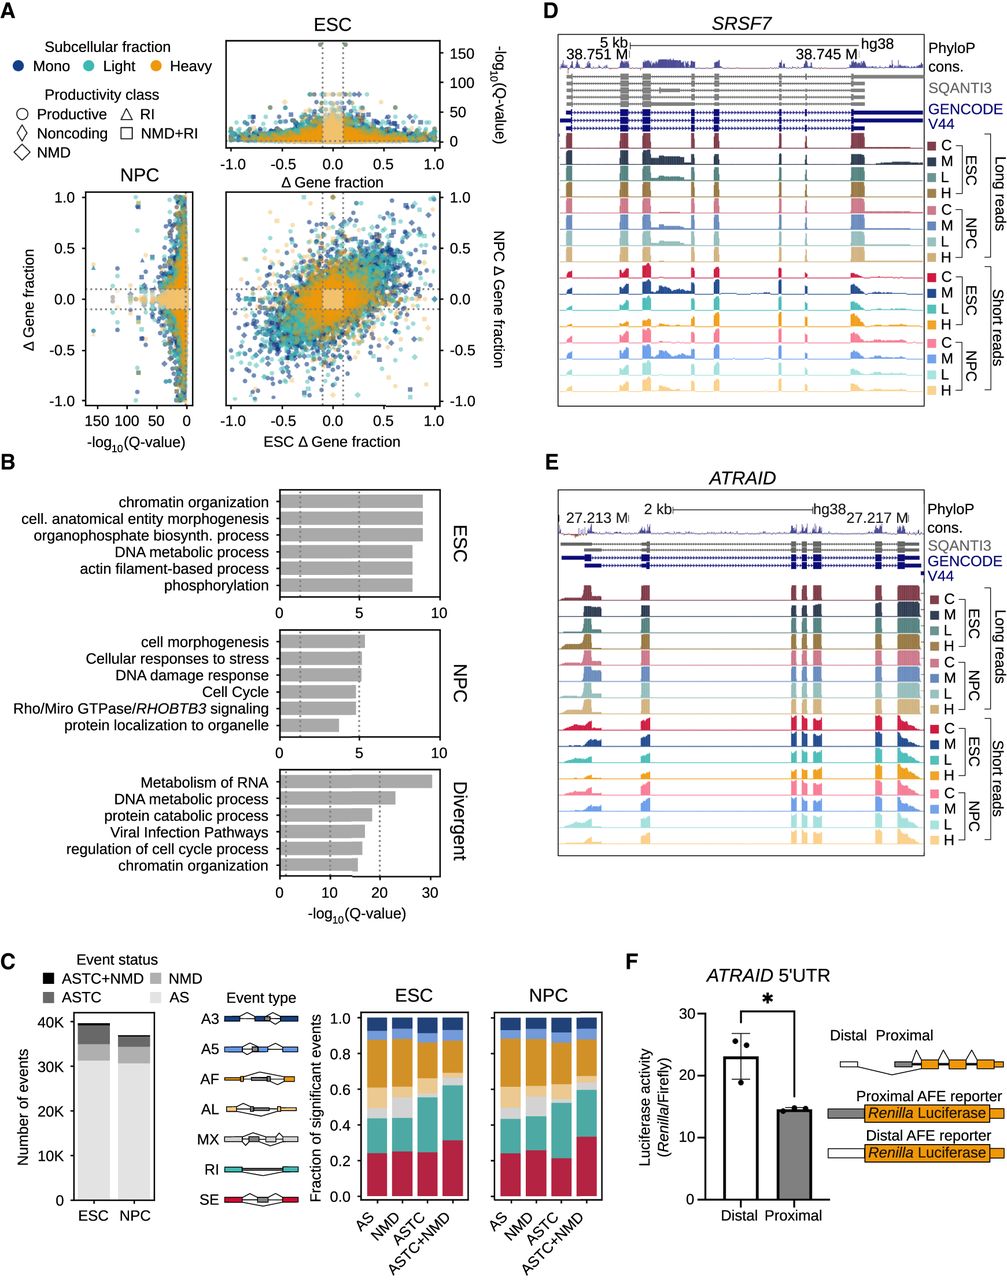
Differential isoform sedimentation across the gradient and functional outcomes of alternative splicing (AS). (A) Volcano plots representing differential isoform sedimentation by changes in isoform gene fraction relative to the cytosol; 3321 and 2254 genes in ESCs and NPCs, respectively, exhibit significant differential isoform sedimentation (|Δ gene fraction| ≥ 0.1, Q-value ≤ 0.05). The central plot shows changes in isoform gene fraction, with Q-value ≤ 0.05, of isoforms expressed in both ESCs and NPCs. (B) The first two bar plots show the top six enriched Metascape pathways in genes containing significant instances of differential isoform sedimentation exclusively in ESCs or NPCs. The third bar plot, labeled “divergent,” depicts enriched Metascape pathways in genes displaying contrasting patterns of isoform sedimentation between ESCs and NPCs. (C) The first stacked bar plot categorizes significant AS events (|ΔΨ| ≥ 0.1, adjusted P-value or Q-value ≤ 0.05) as AS; AS coupled with translational control (ASTC), meaning splicing events that are differentially included across the gradient; NMD; and AS coupled with both translational control and nonsense-mediated decay (ASTC + NMD). The following two bar plots show the breakdown of event types comprising each category in ESCs and NPCs. (D,E) UCSC Genome Browser snapshot of long-read and short-read coverage at SRSF7 (D), exhibiting subcellular fraction–associated inclusion of a conserved retained intron, and at ATRAID (E), exhibiting subcellular fraction–associated alternative first exon usage. Fractions: (C) cytosol, (M) Mono, (L) LPR, and (H) HPR. (F) Luciferase assay measuring the translational impact of using either the distal or the proximal ATRAID 5′ UTR in HEK293 cells.