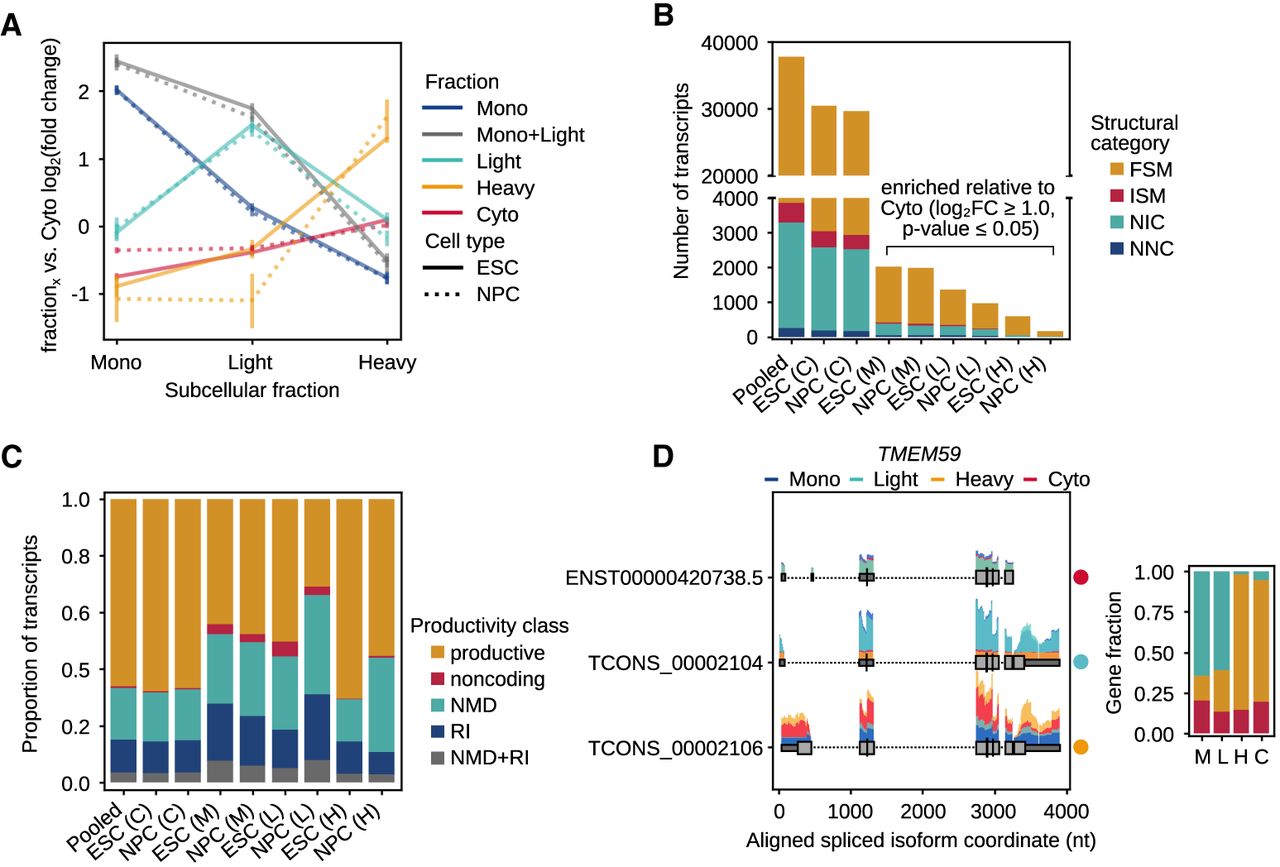
Establishing transcript ribosome association profiles. (A) Clustering of transcripts by their expression trajectories across the gradient relative to the cytosol. (B) Extraction of fraction-associated transcripts based on significant enrichment (log2FC ≥ 1.0, P-value ≤ 0.05) in the Mono, LPR, or HPR fractions relative to their abundance in the cytosol. Fractions: (C) cytosol, (M) Mono, (L) LPR, and (H) HPR. (C) Categorization of fraction-associated transcripts by productivity. (D) Differential sedimentation of three isoforms in TMEM59. Above spliced isoform models, histograms of short-read support at exons are colored by fraction. The stacked barplot summarizes the proportion of total gene expression each isoform contributes in each subcellular fraction.