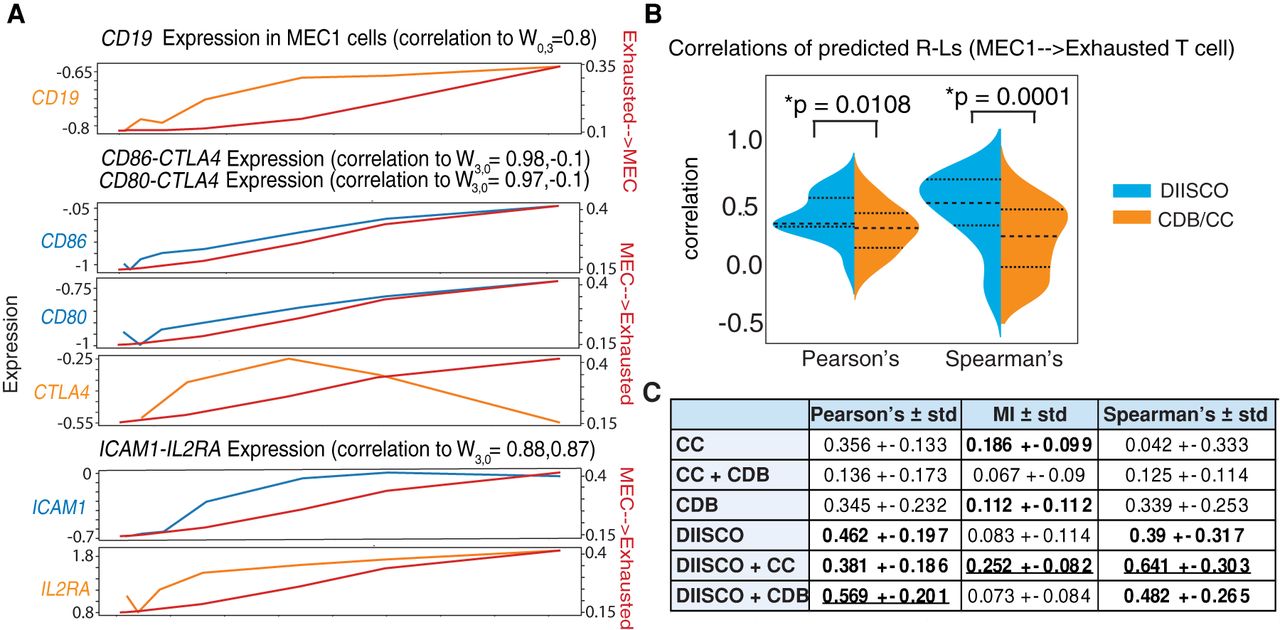
Comparing predicted R–L pairs with existing methods. (A) R–L pairs are highly correlated with DIISCO-predicted Wexhausted↔MEC interaction. Expression of ligands is shown in blue, receptors in orange (left axis), and interaction strength in red (right axis). (B) Comparison of DIISCO-predicted R–L pairs with those predicted using CellChat (CC) or CellPhoneDB (CDB). Correlations between paired R–Ls are shown for the WMEC→exhausted T cell link. P-values calculated with the Mann–Whitney U test. (C) Evaluating temporal correlation of predicted R–Ls using each method: DIISCO, CDB, and CC. A + B refer to R–L pairs predicted by methods A and B. Table shows three different metrics calculated for all R–L pairs: Pearson's correlation, mutual information (MI), and Spearman's correlation. Mean values ± SD are quantified, with the top three highest scores in bold and the highest score underlined.