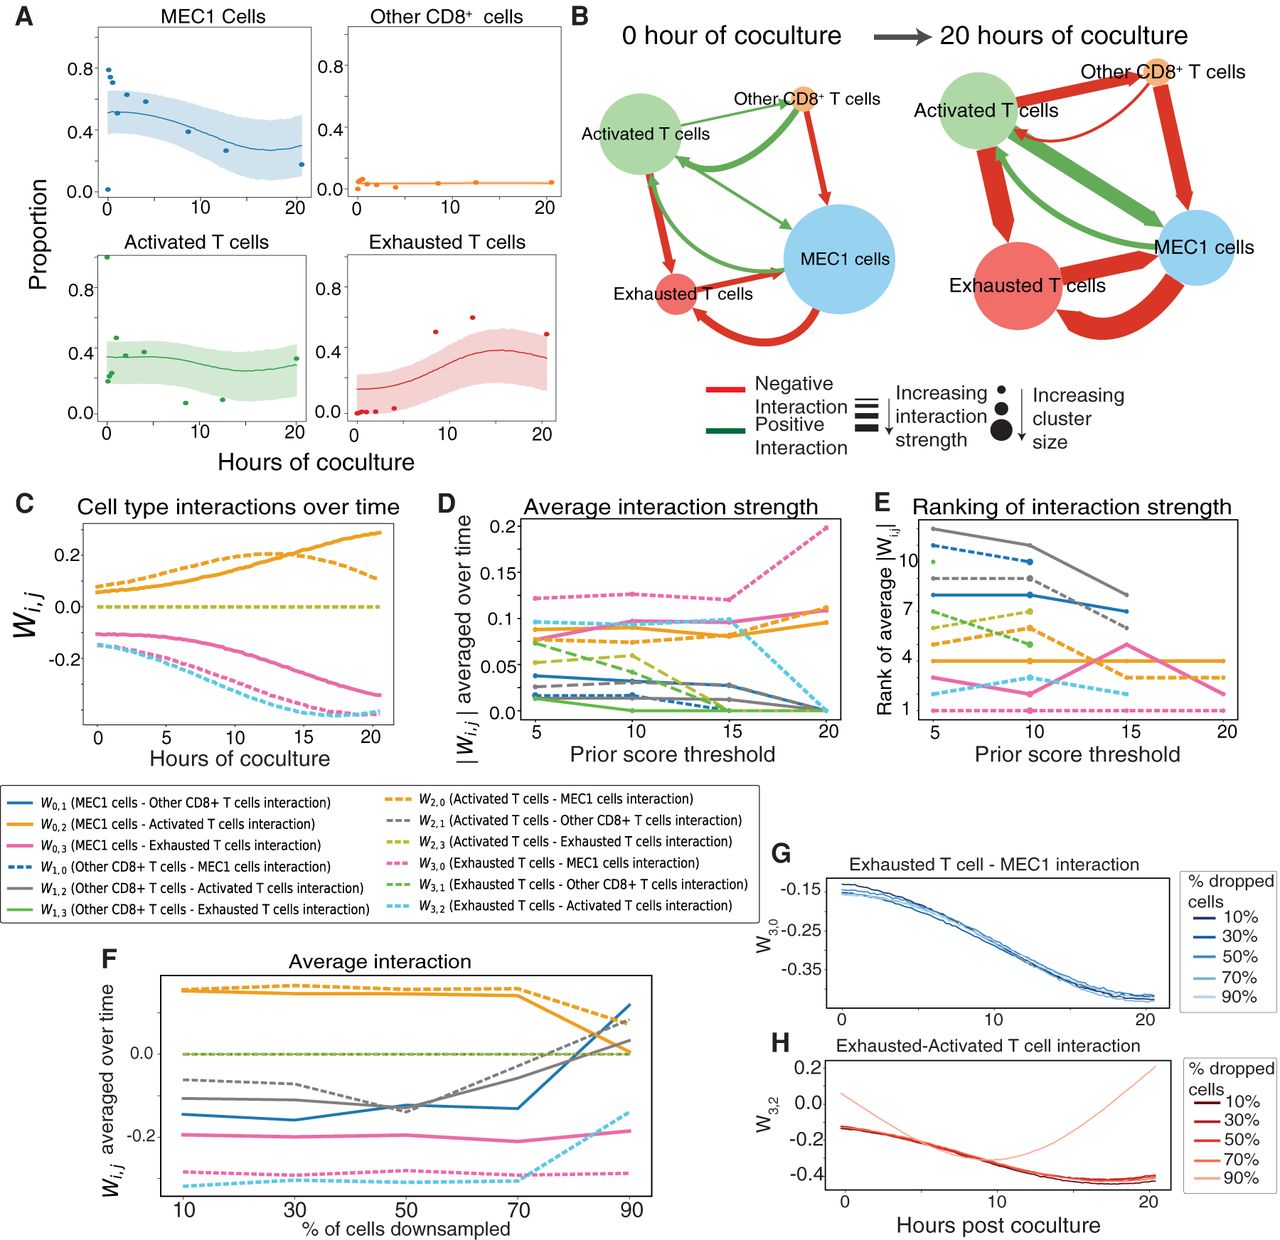
DIISCO performance on CAR T Experiment C. (A) Temporal dynamics of cell types. Data points represent the measured proportion of cell types over time, and DIISCO output is shown as inferred mean (solid line) and one standard deviation (shaded area) of y for each cell type. Additional experiments are shown in Supplemental Figure S2. (B,C) Inferred W interaction matrix at two example time points (B) and over the entire coculture time window (C). Network node size reflects cell type proportion at that time point; arrows and their width designate the direction and strength of inferred interactions, respectively. (D) Average interaction strength between clusters as a function of varying prior thresholds. The binarization threshold indicates the minimum number of R–L interactions between two cluster pairs needed to denote a 1 in the prior matrix. (E) Rank of average interaction strengths as a function of varying prior thresholds. (F) Average interaction score with downsampling total cell number. (G,H) W interaction over time between exhausted T cell and MEC1 cells (G) and exhausted–activated T cells (H) for different percentages of dropped cells.