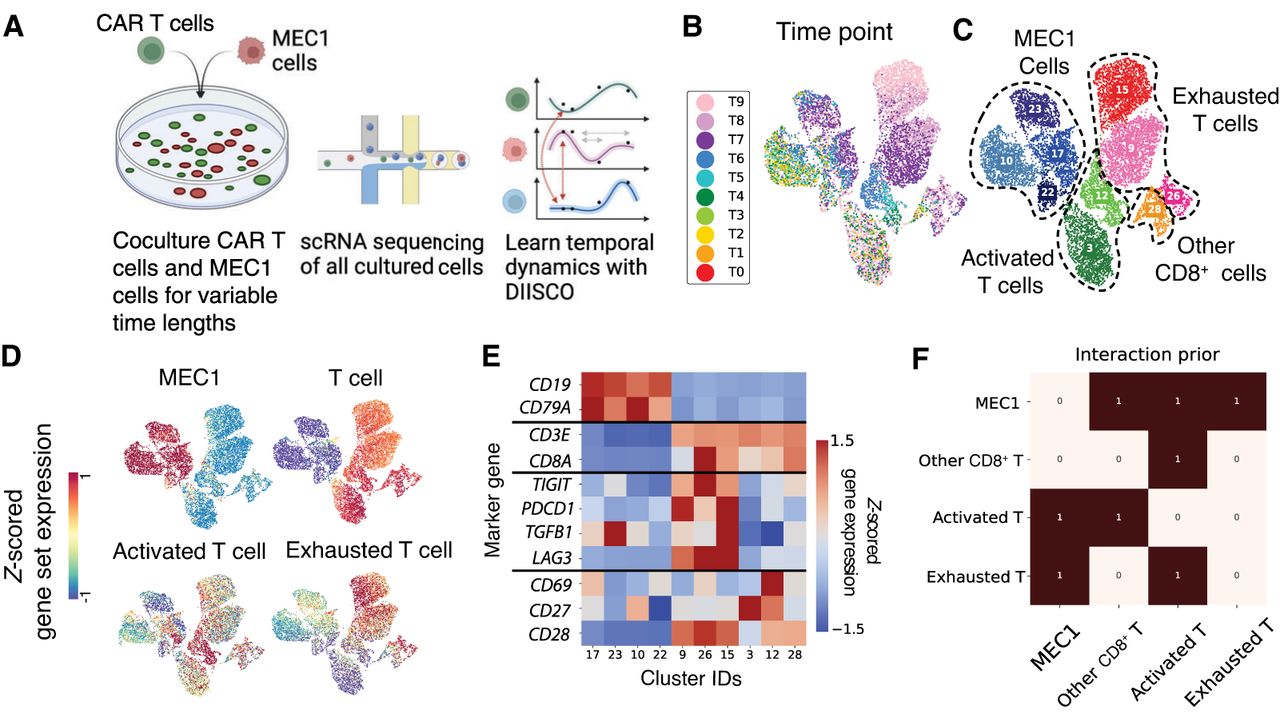
Figure 3.
CAR T experimental setup and data preprocessing. (A) Overview of the data collection process and analysis of coculture experiments outlined in Supplemental Table S1. (B–D) 2D UMAP projection of 9082 single-cell transcriptomes from Experiment C colored by time point (B), cluster and cell type assignment (C), and average expression of different gene set markers (D) used to define metaclusters. (E) Heatmap of average cluster expression of individual genes used in gene set analysis, Z-scored across all clusters. (F) Prior constructed for DIISCO input, generated as explained in Methods.