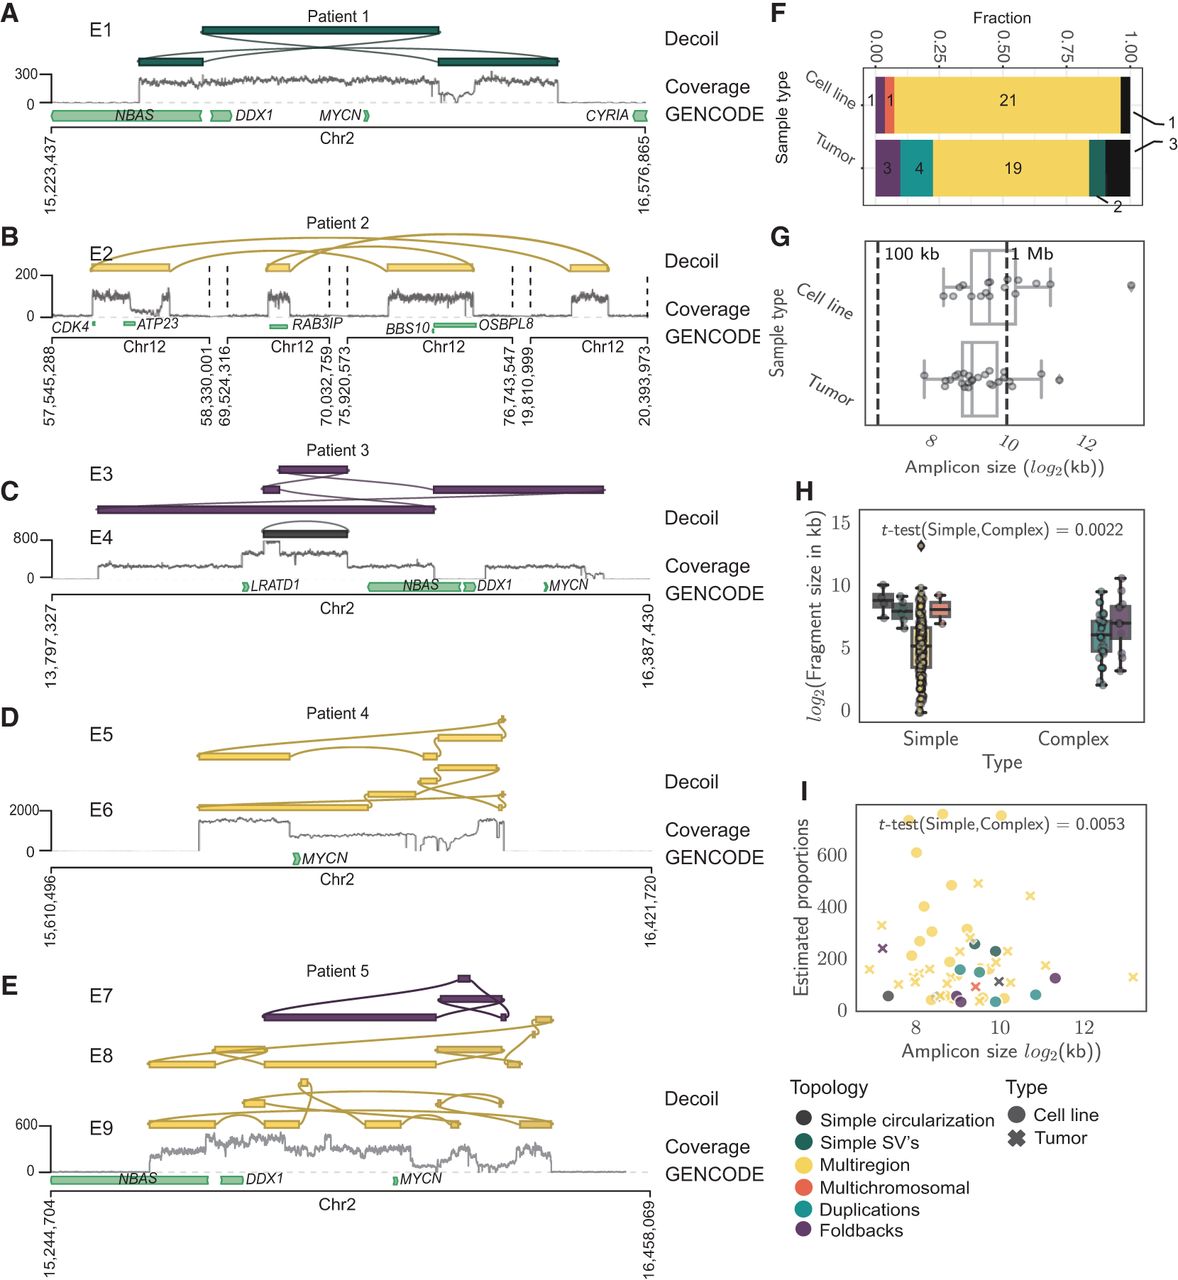
Decoil recovers structurally complex ecDNA elements in primary cancers. Examples of ecDNA structure reconstruction of Simple SVs (A), Multiregions (B,D), Foldbacks (C), and Duplications/Foldbacks topologies (E) in patient samples. (A–E) The tracks represent the Decoil reconstruction (top), coverage of the aligned Nanopore reads to reference genome GRCh38/hg38 (middle), and GENCODE V42 annotation (bottom). The top three reconstructions were included if labeled as ecDNA and had estimated proportions 30 or more copies (A–E). E1–E9 are the IDs for each reconstruction (Supplemental Table S4). (F) The topology spectrum of the reconstructed ecDNA structures by Decoil for the five cell lines and nine patient samples. (G) ecDNA reconstruction total size (x-axis) distribution (y-axis) for all data (five cell lines, nine primary tumor samples). (H) ecDNA fragment size distribution split for simple (Simple circularization, Simple SVs, Multiregion, Multichromosomal) or complex (Duplications, Foldbacks) topologies. (I) ecDNA reconstruction total size (x-axis) against estimated proportions (y-axis) computed by Decoil. (H,I) t-Test statistics were applied to test the significance of the ecDNA proportions between simple and complex topologies. All reconstructions labeled as ecDNA and with estimated proportions of 30 or more copies were included in panels F–I. Box plot shows Q1 (25%), Q2 (median), Q3 (75%), and interquartile range IQR = Q3–Q1; whiskers are 1.5 × IQR. The colors in A–F,H correspond to the legend in I.