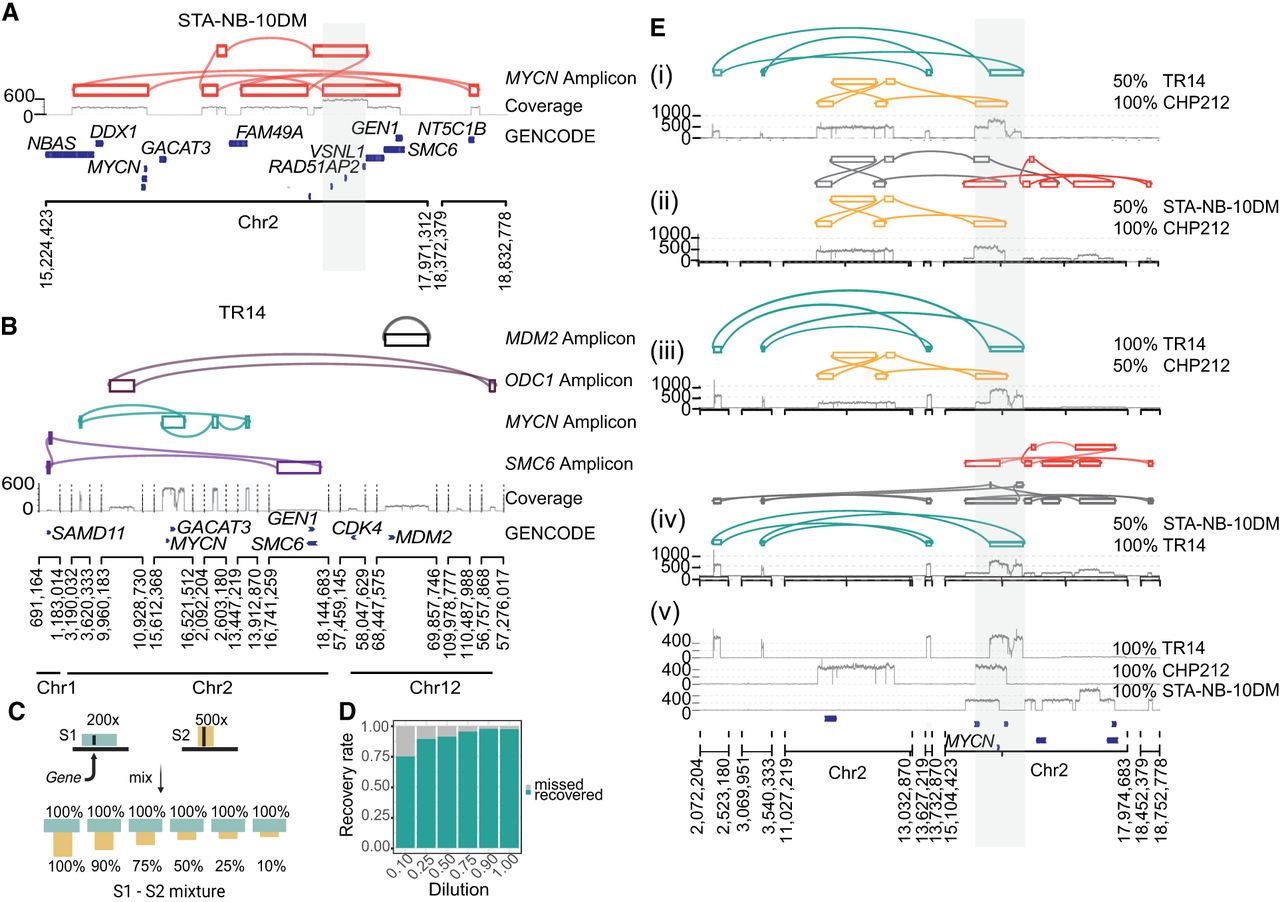
Decoil captures the ecDNA structure complexity and heterogeneity in neuroblastoma cell lines. (A) STA-NB-10DM ecDNA reconstruction by Decoil (top), coverage track (middle) of the aligned reads to reference genome GRCh38/hg38, and GENCODE V42 annotation (bottom). The gray highlighted region Chr 2: 17,221,081–17,538,185 (GRCh38/hg38) represents an interspersed duplication. (B) ecDNA elements co-occurrence reconstructed by Decoil in TR14 (top four tracks), the coverage track (middle), and GENCODE V42 annotation (bottom). (C) In silico dilution strategy, in which two samples, S1 (green) and S2 (yellow), are mixed at different ratios to generate mixture of ecDNAs that overlap in the genomic space. (D) ecDNA breakpoint recall (y-axis) for the in silico cell line mixtures, split by the dilution ratio (x-axis). An ecDNA element harboring MYCN is present in every one of the three cell lines, that is, CHP212, TR14, and STA-NB-10DM, and is composed of 10, eight, and 14 breakpoints, respectively. The other co-occurring ecDNA elements in TR14 are also added to the analysis and have four (ODC1-), two (MDM2-), and six (SMC6-amplicon) breakpoints. (E) ecDNA reconstruction visualization using Decoil-viz for the in silico ecDNA mixtures. (i–iv) The reconstructed ecDNA structures by Decoil in cell line mixtures (green, TR14; yellow, CHP212; and orange, STA-NB-10DM) overlap in the genomic space at the MYCN locus (gray highlight). (v) Coverage track for pure (100%) TR14, CHP212, and STA-NB-10DM cell lines. Misassemblies are depicted in gray.