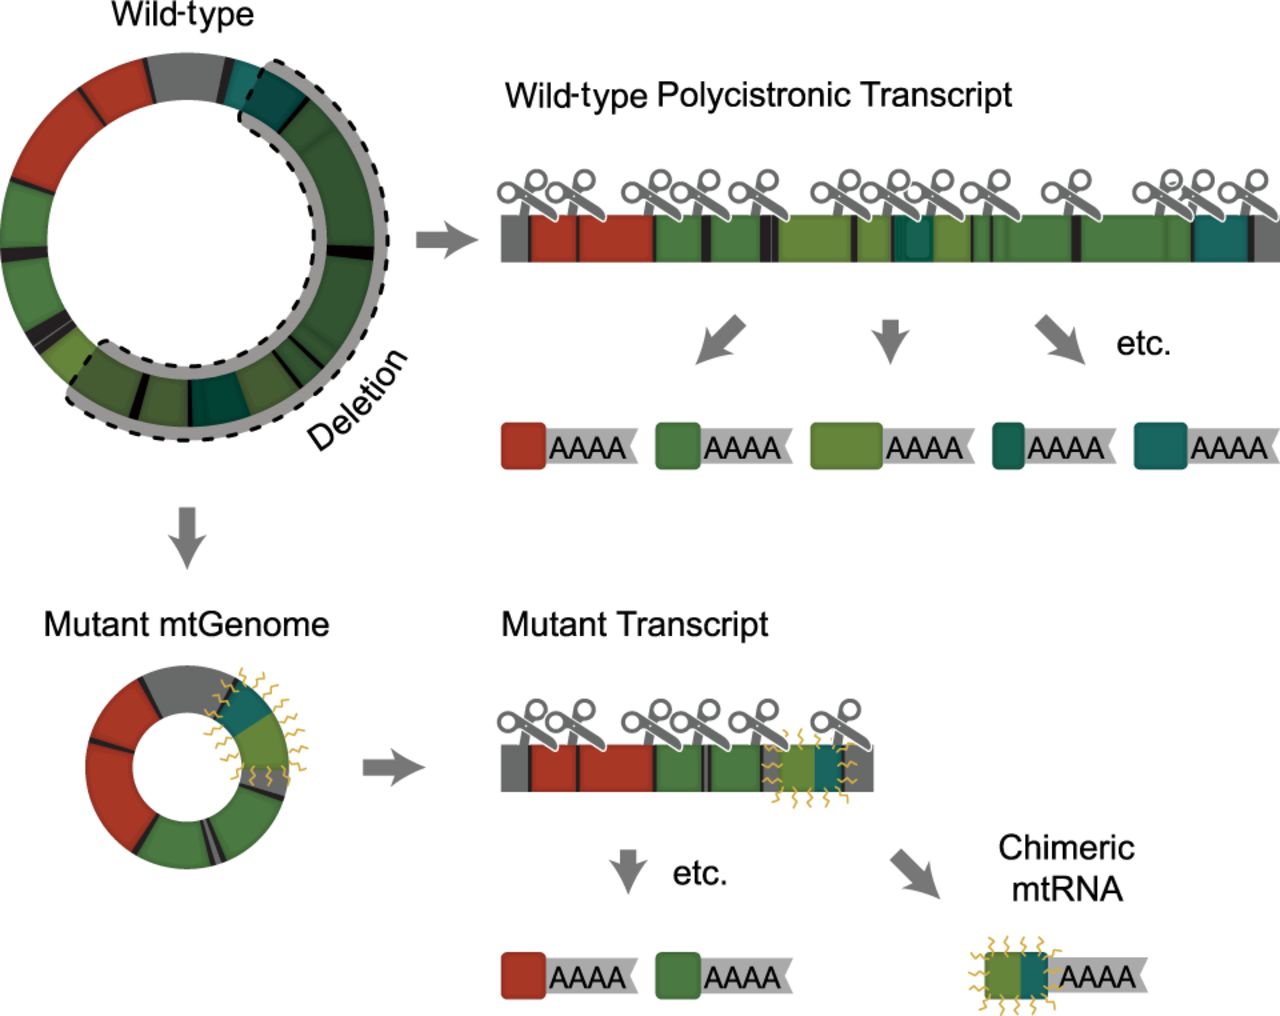
Figure 1.
Diagram outlining the process of mitochondrial transcript processing in wild-type (top) versus mtDNA deletion mutation (bottom) genomes. Different colors denote different electron transport chain complexes or the mitochondrial ribosomal RNAs.