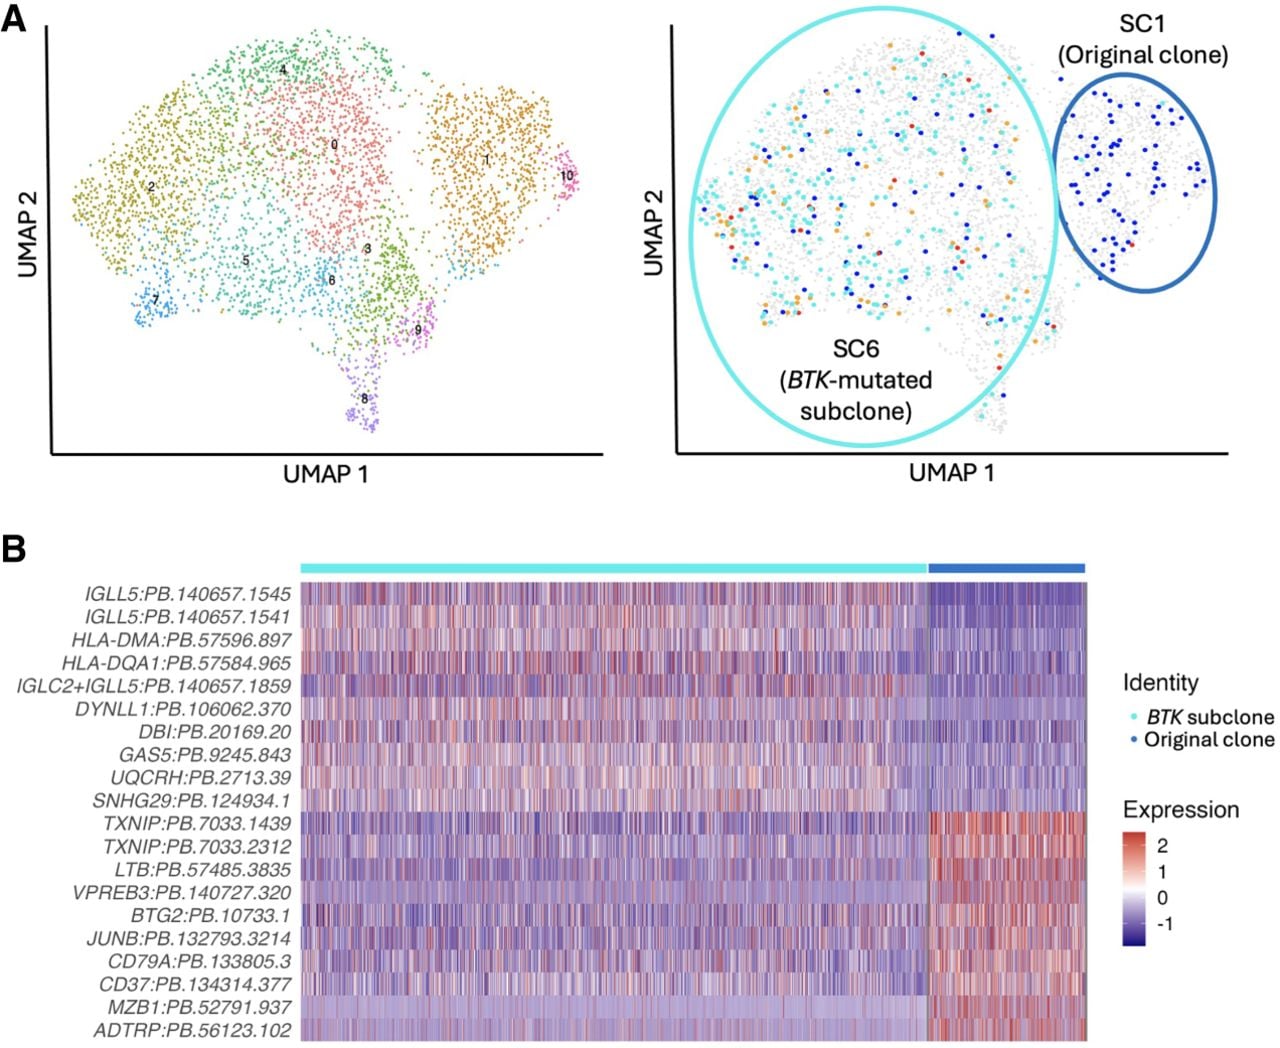
Figure 7.
Using isoform expression analysis to complement gene expression analysis. The isoform expression analysis of the relapse sample of patient 1. (A) UMAP showing the isoform clustering. Mapping subclone assignments to clustered cells enables the identification of the same distinct clones identified in the gene expression analysis. (B) Heatmap showing differentially expressed isoforms between the Original clone and the BTK-mutated subclone. The top 10 upregulated isoforms for each clone are shown.