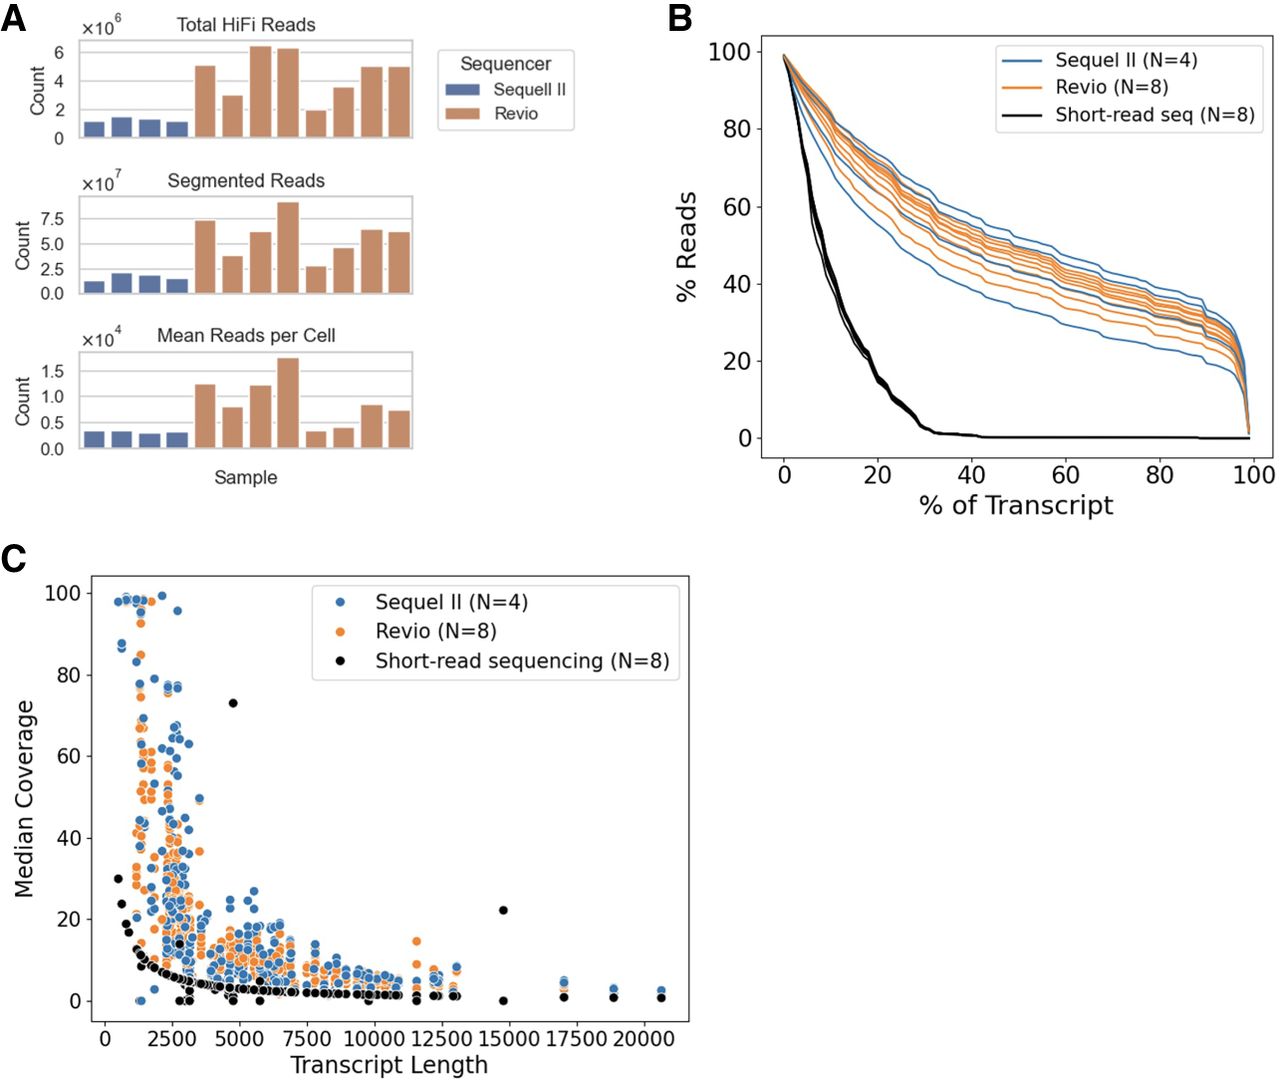
Long-read scRNA-seq metrics. (A) Comparison of the total number of HiFi reads, the total number of segmented reads, and the mean reads per cell for each sample, colored by the sequencer used. (B) The canonical transcript coverage for each read aligning to a given gene is calculated for all protein-coding genes with at least one read aligned to it. The percentage of reads covering X% of the given transcript is plotted for each sample and colored by the sequencer used for the sample. Eight short-read samples are included in black for comparison. (C) Comparison of the median coverage from each sample for the 112 CLL driver genes included in this study. Genes are sorted along the x-axis by the length of the canonical transcript. Each dot represents the coverage of the given gene for a sample, colored by the technology used to sequence the sample.