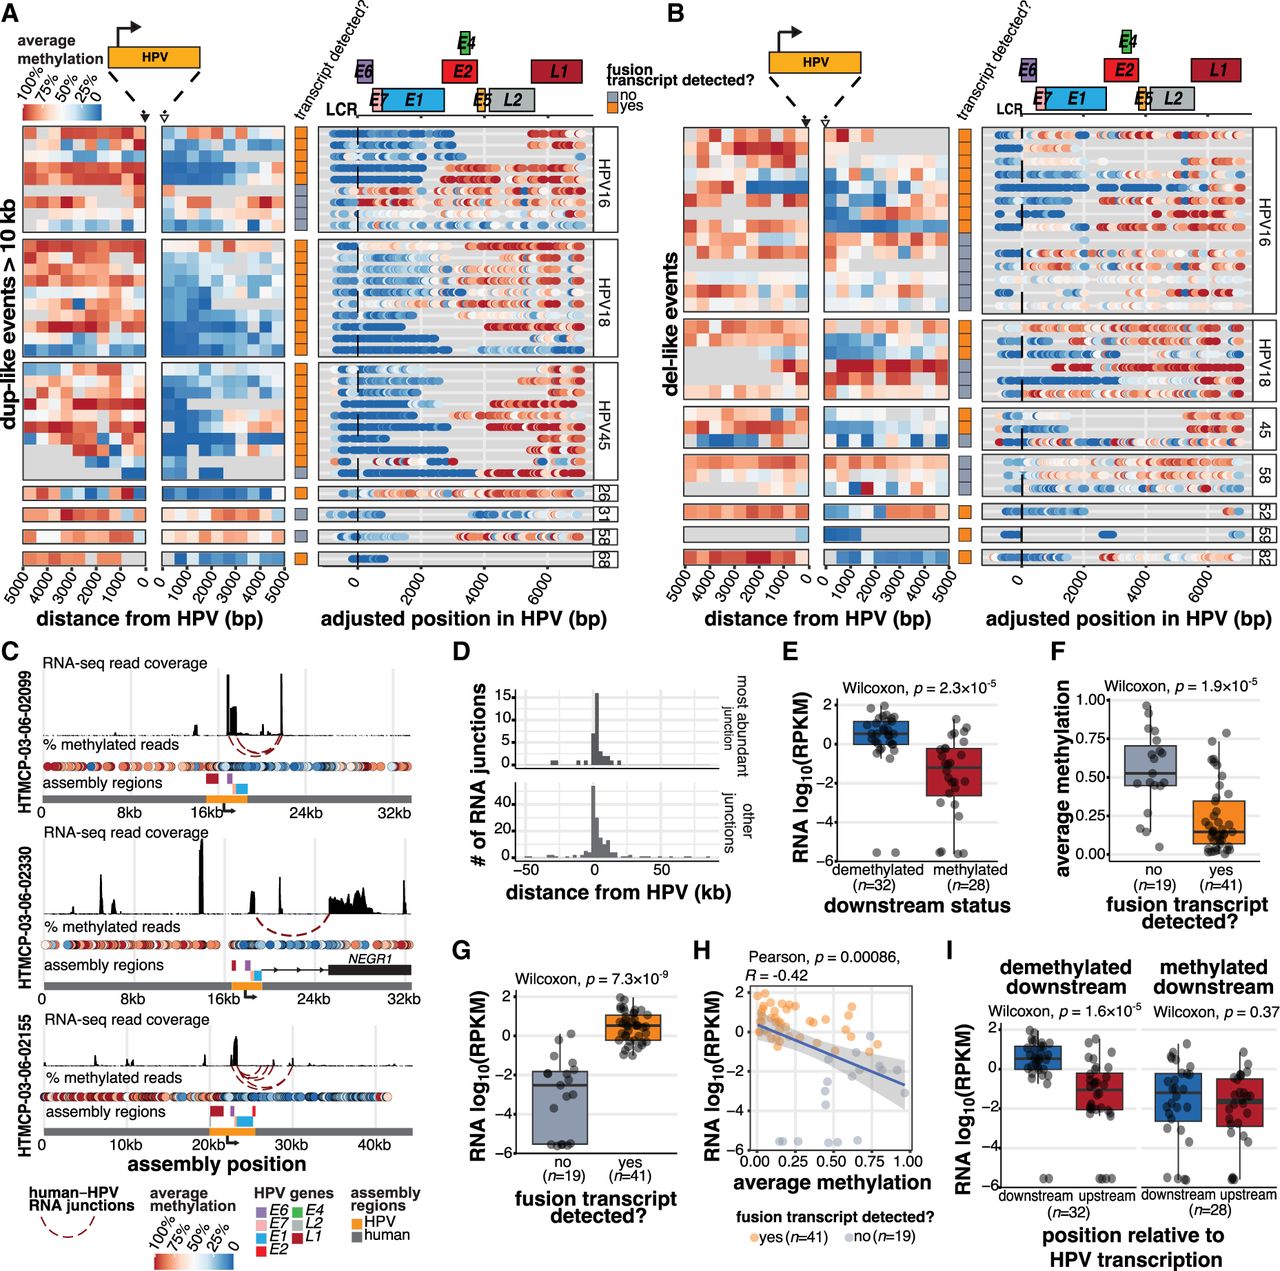
The production of HPV fusion transcripts correlates with distinct methylation patterns adjacent to and within the HPV integrant. (A,B) The proportion of HPV-containing reads showing methylation at positions within and adjacent to HPV integrants in (A) dup-like events (amplified region >10 kb) and (B) del-like events. The regions 5 kb upstream of and downstream from (relative to the direction of HPV transcription) are divided into 500 bp bins, and the average methylation frequency for all the CpGs within each bin is shown. Within HPV, the methylation of each CpG bin is shown as a colored dot. The transcriptional status is also indicated for each event (row). All the events are aligned to the start of the genic region (E6 start) for each respective HPV type. The gene model for HPV16 is shown above for general reference. (C) The assemblies of three representative HPV integration events, including their human and HPV gene positions, RNA-seq coverage, and HPV–human fusion junctions. (D) The position of HPV–human RNA fusion points relative to the nearest DNA HPV breakpoint, oriented by the strand of the HPV integrant. The most abundantly expressed junctions (n = 36) are contrasted with all other identified junctions (n = 163). (E) The normalized expression (RPKM) within the 5 kb region downstream from the HPV integrant, stratified by the downstream methylation status. (F) The average downstream methylation (0 to 2500 bp), stratified by HPV transcription status. (G) The normalized expression in reads per kilobase per million (RPKM) within the 5 kb region downstream from the HPV integrant, stratified by the HPV transcription status. (H) Pearson's correlation between downstream methylation and expression in transcribed and nontranscribed events. (I) The difference in the expression (RPKM) upstream of and downstream from (±5 kb) the HPV integrant in events stratified by the downstream methylation status. In all cases, box plots represent the median and upper and lower quartiles of the distribution; whiskers represent the limits of the distribution (1.5 IQR below Q1 or 1.5 IQR above Q3). P-values were calculated using the Wilcoxon rank-sum test and Pearson's correlation, as indicated in the figures. The data points in E–I and the accompanying statistics are from the dup-like and del-like events shown in A and B.