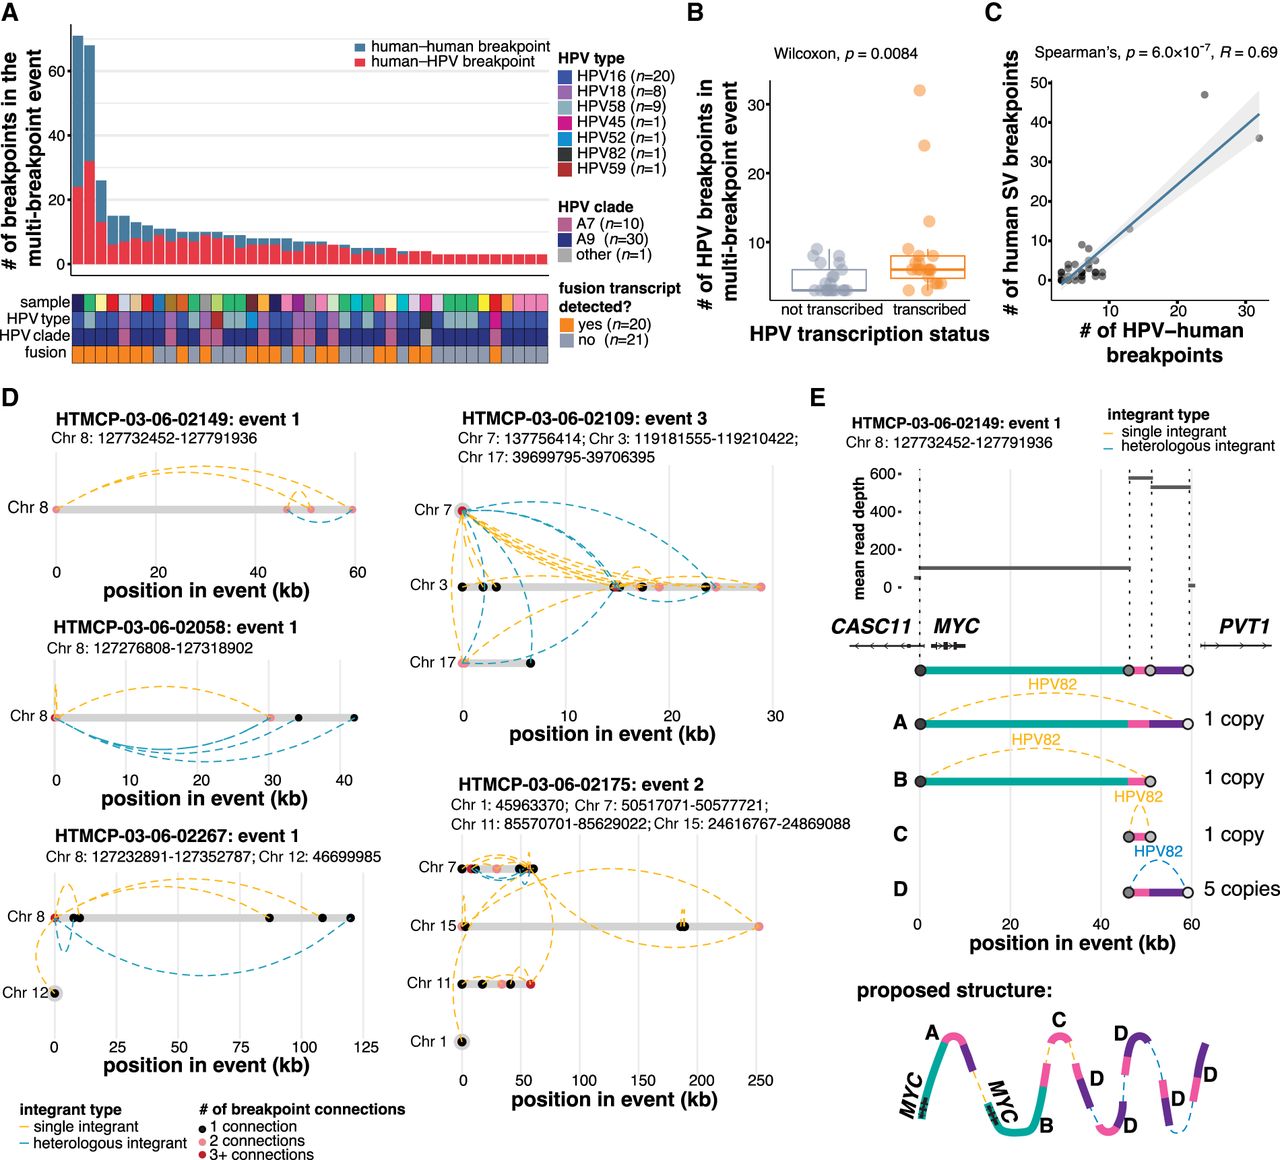
Complex structural variation is associated with multi-breakpoint integrations. (A) The number of human–HPV and human–human SV breakpoints across multi-breakpoint integration events, and the HPV type and clade in each. (B) The number of breakpoints per event in transcribed and nontranscribed multi-breakpoint events. Box plots represent the median and upper and lower quartiles of the distribution; whiskers represent the limits of the distribution (1.5 IQR below Q1 or 1.5 IQR above Q3). (C) Spearman's correlation between the number of HPV–human breakpoints and the number of human–human SV breakpoints in multi-breakpoint events. (D) Examples illustrating the connectivity between HPV breakpoint pairs in five multi-breakpoint events: three from the MYC-associated locus on Chromosome 8 and the two most rearranged multi-chromosomal events. Dots denote HPV breakpoints along the event, and dotted lines represent the HPV integrants that connect the breakpoints. The dots are colored according to the number of connections that converge at that position in the event. The integrants are colored according to whether single (orange) or heterologous (blue) integrant structures connect the breakpoints. (E) An example breaking down the copy number changes and the proposed structure of an event overlapping MYC. Each color represents a genomic segment on Chromosome 8 in between two human–HPV breakpoints. P-values in B and C were calculated using the Wilcoxon rank-sum test and Spearman's correlation test.