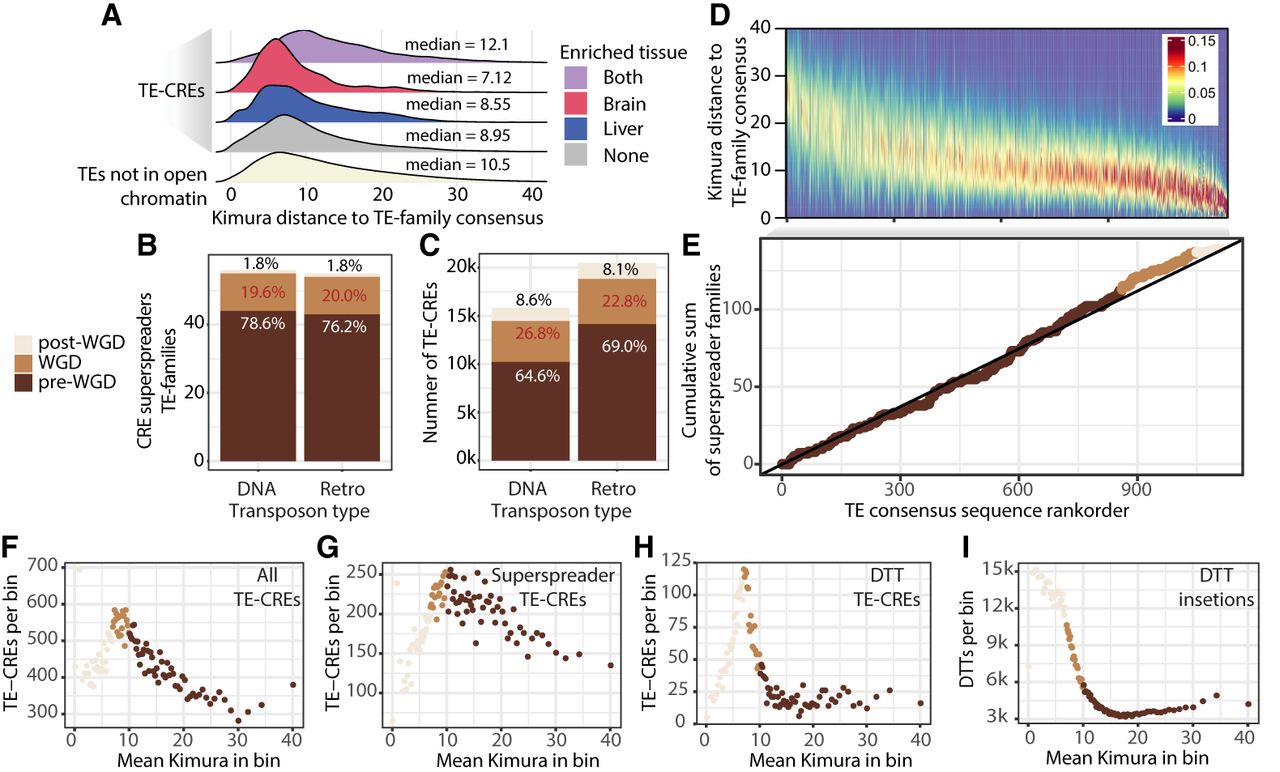
Temporal dynamics of TE-CRE insertion activity by TE taxonomy. (A) Distribution of sequence divergence of TE-CREs from their TE-subfamily consensus sequence. Colors represent if TE-CREs are from TE subfamilies with superspreader ability (liver, brain, or both) or not (gray). (B) Number of TE subfamilies with superspreader ability subdivided into DNA elements and retroelements. Colors represent the TE-subfamily age proxy calculated as mean divergence between genomic insertions and their consensus TE sequence. (Post-WGD) <7 Kimura distance, (WGD) 7–10 Kimura distance, (pre-WGD) >10 Kimura distance. (C) Number of TE-CREs from TEs with a taxonomic classification subdivided into DNA elements and retroelements. Colors represent the TE-subfamily age proxy. (D) Heatmap of the divergence distributions of all insertions per TE subfamily (with more than 500 insertions) to their consensus sequence. TE families are ordered based on mean divergence from consensus. (E) Cumulative distribution of CRE-superspreader TE families ordered by mean Kimura distance between genomic copies and TE-subfamily consensus sequence. Colors represent age proxy as defined by mean divergence to TE-subfamily consensus sequence (F–I) The number of TE-CREs (F–H) and TE insertions (I) per “age”-bin of Kimura distances for all TE-CREs, TE-CREs from superspreader families, and TE-CREs from the DTT superfamily.