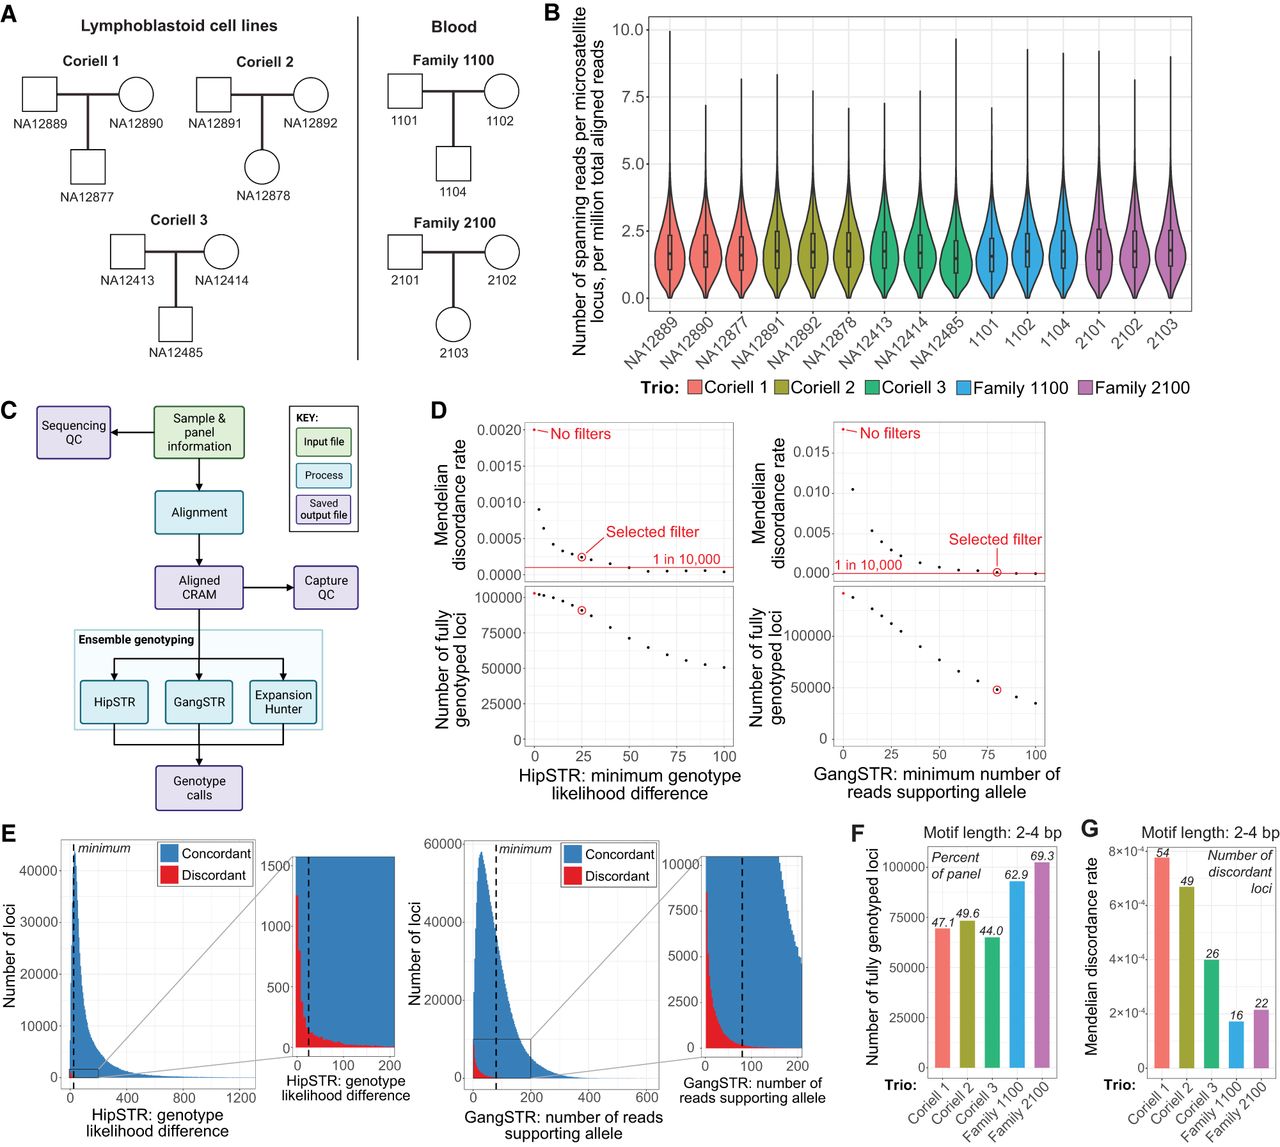
Large-scale microsatellite capture, genotyping pipeline STREAM, and Mendelian discordance analysis. (A) Five family trios profiled with our large-scale microsatellite panel. (B) Distribution of coverage across targeted microsatellite loci for the large-scale panel. Trios are arranged by trio in the following order: father, mother, child. Normalized coverage is plotted as the [number of microsatellite-spanning reads at the locus]/[number of million aligned reads in the sample]. Box-and-whisker plot shows first quartile, median, and third quartile of distribution. Whiskers show 1.5× the interquartile range. (C) Simplified schematic of STREAM, our microsatellite ensemble genotyping pipeline that optimally integrates calls from HipSTR, GangSTR, and ExpansionHunter. (QC) Quality control. A detailed schematic of the pipeline is shown in Supplemental Figure S9, C and D. (D) Representative plots of filter parameter optimizations for STREAM based on Mendelian discordance rates and the number of loci genotyped at different thresholds. Data are shown for Family 1100. Red dot indicates values without quality filtering; red circle, threshold value chosen for final filtering settings; and red line, approximate expected microsatellite de novo mutation rate (i.e., Mendelian discordance rate) based on prior studies (Weber and Wong 1993; Huang et al. 2002; Sun et al. 2012; Kristmundsdottir et al. 2023). Note that individual parameter filters do not achieve the expected discordance rate, and the final filter settings utilize an optimized combination of filters to achieve the expected discordance rate (Methods). For plots of other filter parameter optimizations, see Supplemental Figure S11. (E) Overlayed histograms of parameter values across all loci for two of the filtering parameters we optimized. Histograms are generated from data from all 15 samples captured with the large-scale panel. Plots include only fully genotyped loci, as only these loci have concordance calls. Concordant calls are blue, and discordant calls are red. The zoom plot shows the distribution of discordant calls near the final filtering threshold. Dashed line indicates the chosen threshold in our final filter settings. For similar plots of other filter optimization parameters, see Supplemental Figure S12. (F) Number of fully genotyped 2–4 bp motif length loci for each family trio, that is, loci with genotypes called for all three members of the trio. Italics indicate the fraction of the capture panel that is fully genotyped. (G) Mendelian discordance rate of fully genotyped loci with 2–4 bp motif lengths in each family trio. Mendelian discordance rate = [number of discordant loci]/[number of fully genotyped loci]. Italics indicate the number of discordant 2–4 bp motif length loci.