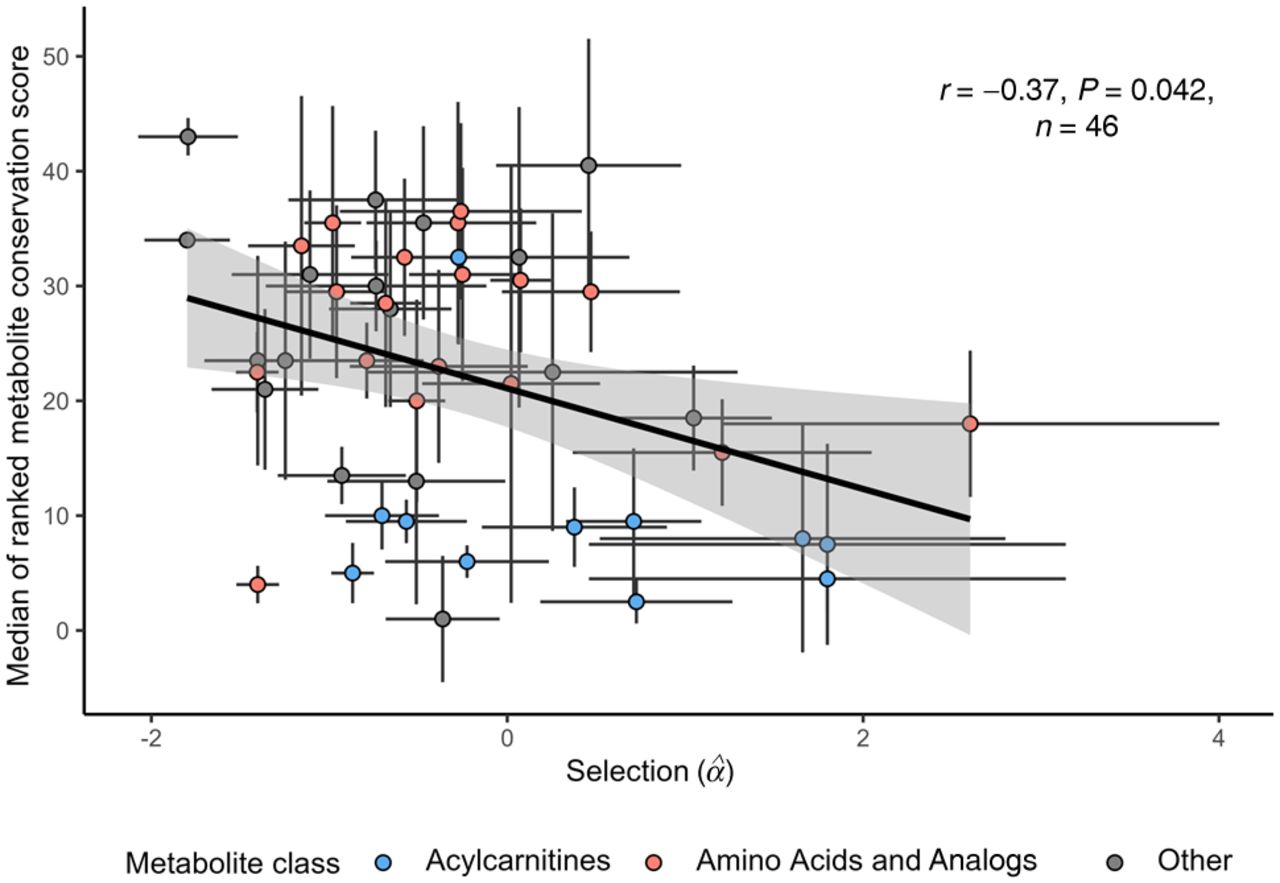
Metabolites under stronger stabilizing selection show stronger evolutionary conservation across mammals. Pearson correlation coefficient is indicated on the plot. The indicated P-value is determined by adjusting for nonindependence between the metabolites (see Methods). Evolutionary conservation of metabolite concentrations is estimated by a single “metabolite conservation score” calculated from cross-species metabolomic data in four organs: brain, heart, liver, and kidney (see Methods). Line depicts the fitted linear regression. Colors represent two metabolite classes, amino acids (including essential, nonessential, and other amino acids) and their derivatives (red) and acylcarnitines (blue). Error bars represent the SE of the (x-axis) and SD of the metabolite ranks across the four organs.