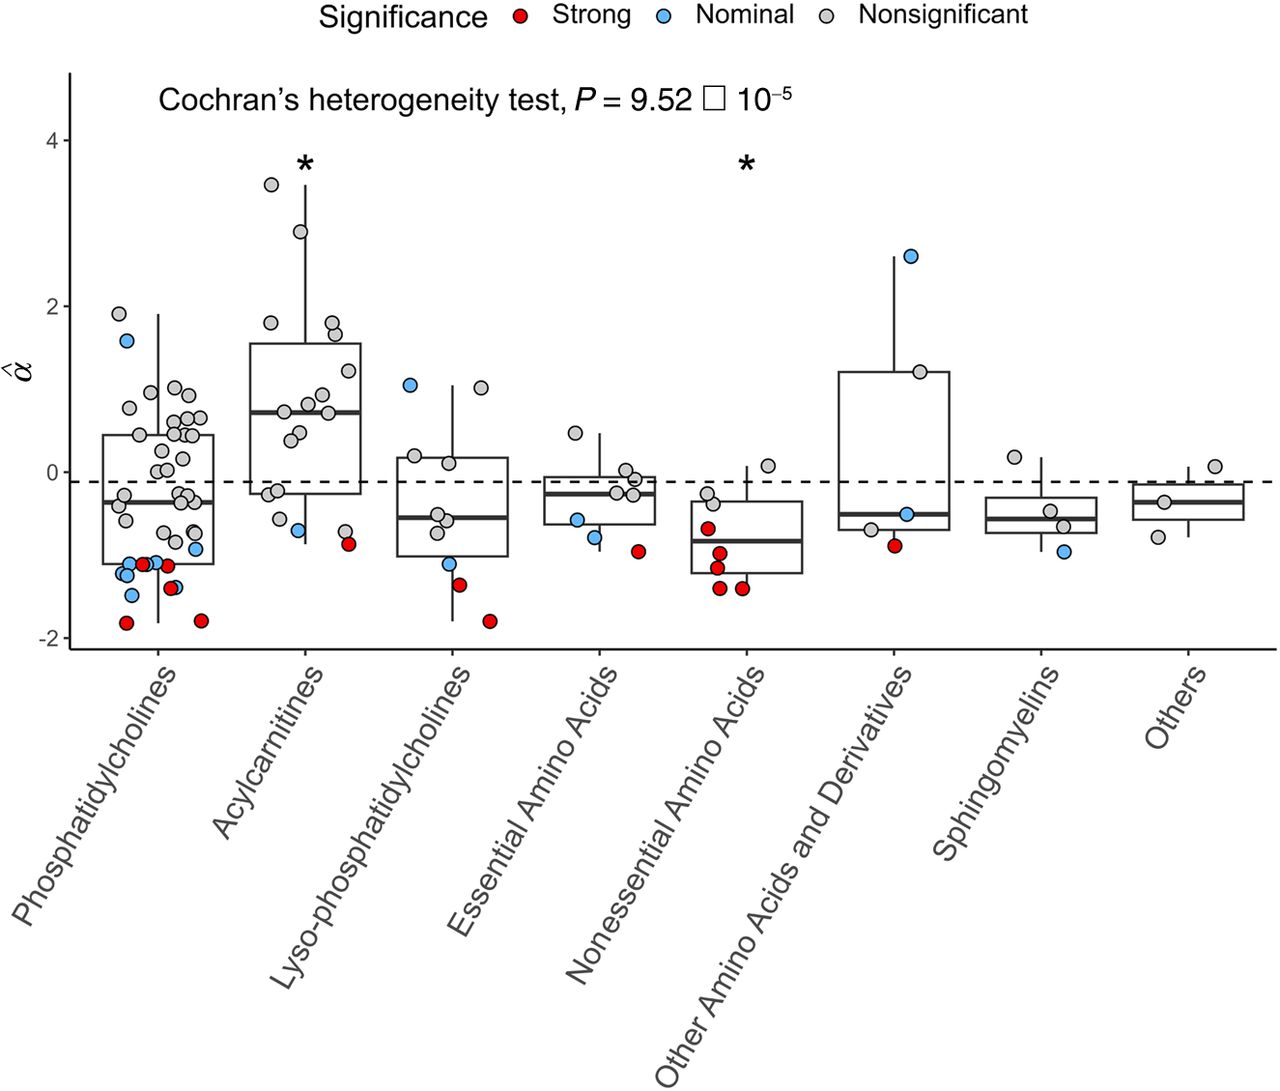
Selection estimates vary significantly across metabolite classes. Plot compares the estimated α values across different metabolite compound classes. Note that the groups essential amino acids and nonessential amino acids include proteinogenic amino acids, and other amino acids and derivatives include nonproteinogenic amino acids and compounds derived from them. The values show significant heterogeneity across metabolite classes (adjusted Cochran's heterogeneity test, Q = 31.95, P = 9.52 × 10⁻⁵). Comparisons of metabolites within a particular class against the rest of metabolites reveal two classes that differ significantly (denoted by asterisks): acylcarnitines and nonessential amino acids (adjusted t-test P = 0.044 and P = 0.0038, respectively). Boxes depict the interquartile range (IQR); the solid black line shows the median; and the whiskers extend to 1.5 IQR. The dashed line indicates average value across all investigated metabolites. Colors represent the significance level of the selection estimates.