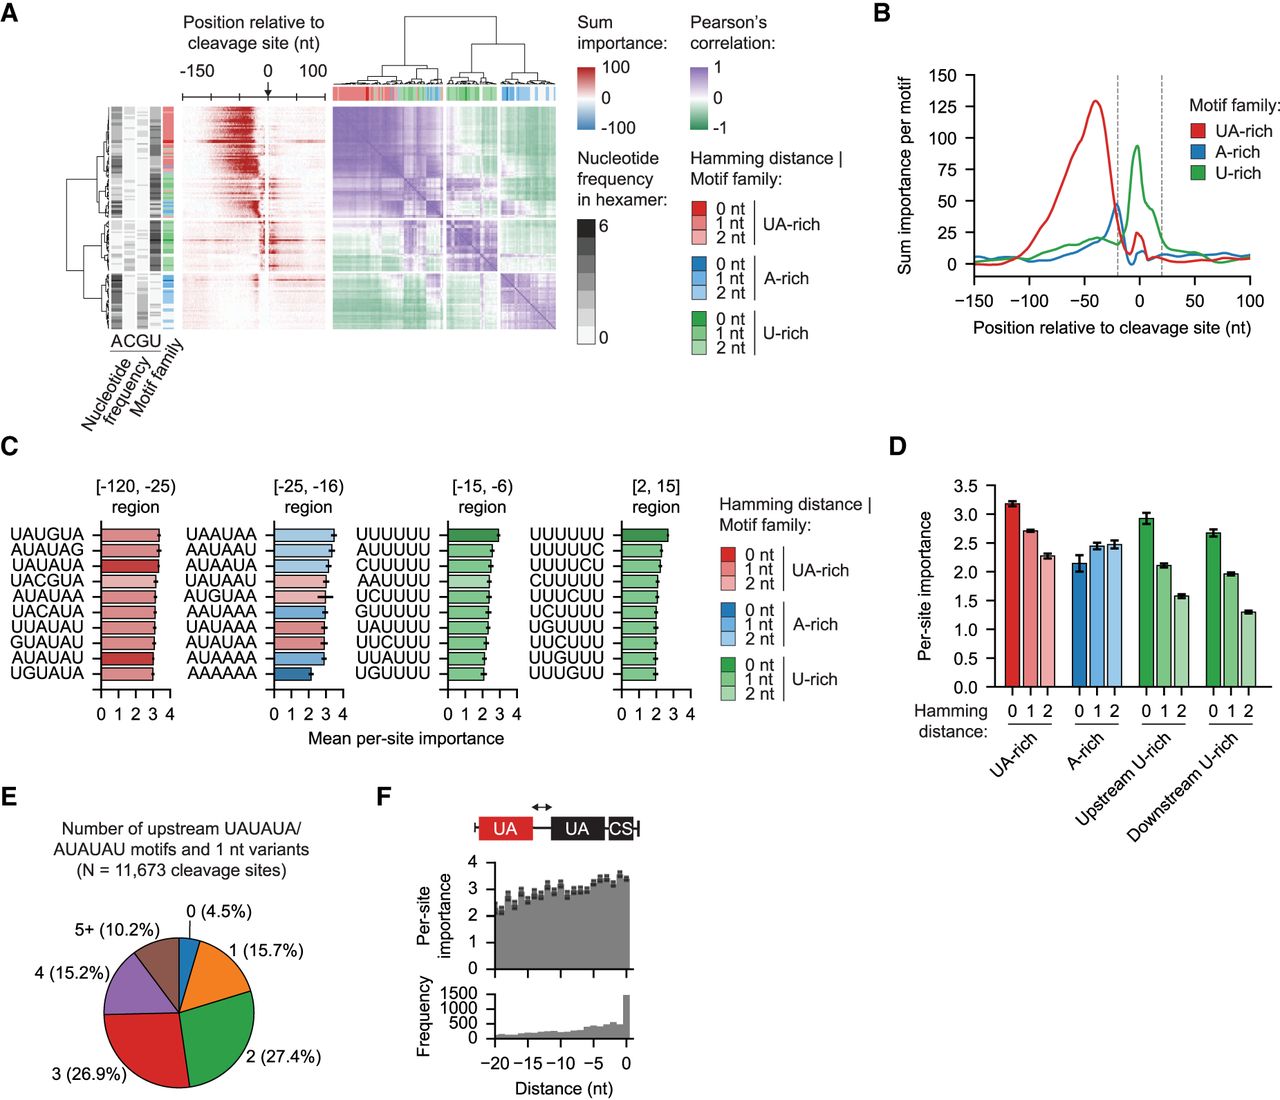
Identifying cis-regulatory elements mediating poly(A) site formation in S. cerevisiae. (A) Heatmaps showing the sum classification importance (left) and Pearson's correlation between motif importance profiles (right) for cis-regulatory elements significantly contributing to poly(A) site definition (N = 137). Each row represents a hexamer motif and is annotated with the nucleotide content and motif family. Motif families were defined by the Hamming distance between the hexamer and the archetypical motifs UAUAUA/AUAUAU (UA-rich), AAAAAA (A-rich), or UUUUUU (U-rich). (B) The per-motif sum classification importance profiles centered at the cleavage site for the cis-regulatory element families. Significant motifs with a Hamming distance ≤2 nt were included for each family (N = 40 UA-rich, 31 A-rich, and 51 U-rich motifs). (C) Bar plots showing the per-site importance score of the top 10 motifs in each region surrounding the cleavage site. Bars are colored by the family to which the motif belongs. Data are presented as the mean and the 95% confidence interval (error bar). (D) Bar plot summarizing the mean per-site importance for cis-regulatory elements grouped by their motif family and Hamming distance in their region of peak activity. UA-rich motifs occur in the [–120,–25] region (N = 2 for Hamming distance 0 nt, 29 for 1 nt, 9 for 2 nt), A-rich (N = 1 for Hamming distance 0 nt, 12 for 1 nt, 18 for 2 nt) in the [–5,–15] region, and U-rich in the [–15,–5] and [2,15] regions (N = 1 for Hamming distance 0 nt, 18 for 1 nt, 32 for 2 nt). Data are presented as the mean and the 95% confidence interval (error bar). (E) The fraction of poly(A) sites (100 or more PASS reads and 5% expression relative to the max site) with nonoverlapping upstream efficiency elements, indicated by the presence of AUAUAU/UAUAUA and 1 nt variants (N = 11,673 sites). (F) The per-site importance (top) and frequency (bottom) of upstream UA-rich motifs are grouped by the distance to the last UA-rich motif closest to the cleavage site. Only the two UA-rich motifs located closest to the cleavage sites were included in the analyses (N = 9306 sites). Data are presented as the mean and the 95% confidence interval (error bar).