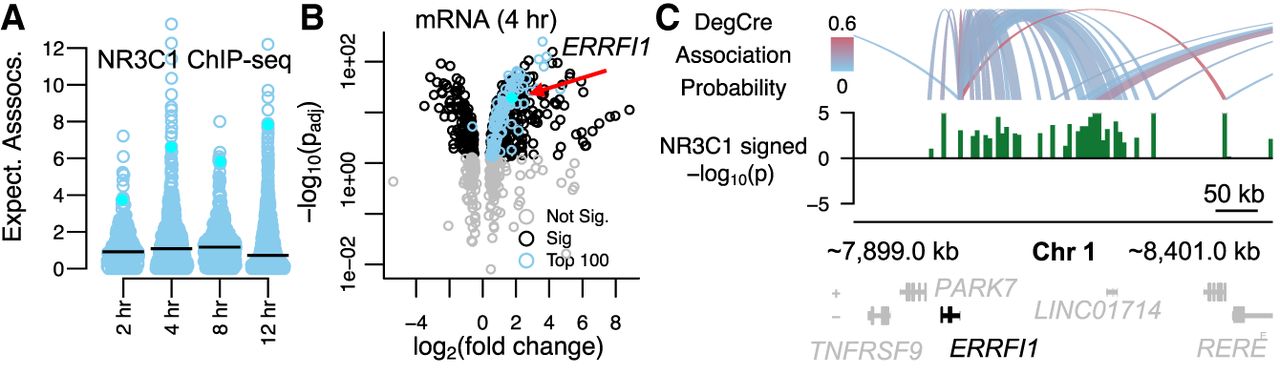
Identification of dexamethasone target genes with DegCre. (A) The boxplot shows the distribution of expected DegCre associations per significant DEG (FDR ≤ 0.05) based on NR3C1 ChIP-seq data from McDowell et al. The black line shows the median expected DegCre associations per DEG. The cyan points show values for ERRFI1. (B) The volcano plot shows the −log10 of the adjusted (Bonferroni) differential expression P-value versus the log2 fold-change. Blue dots indicate genes whose expected number of associations is in the top 100 of all significant DEGs. (C) The browser view shows DegCre associations (top panel) and NR3C1 ChIP-seq signal at 4 h for an established glucocorticoid pathway target gene, ERRFI1. The NR3C1 signal is plotted as –log10 of the differential P-value multiplied by the sign of the log fold-change. Regions of NR3C1 signal have been merged in some cases for better visibility at browser scale.