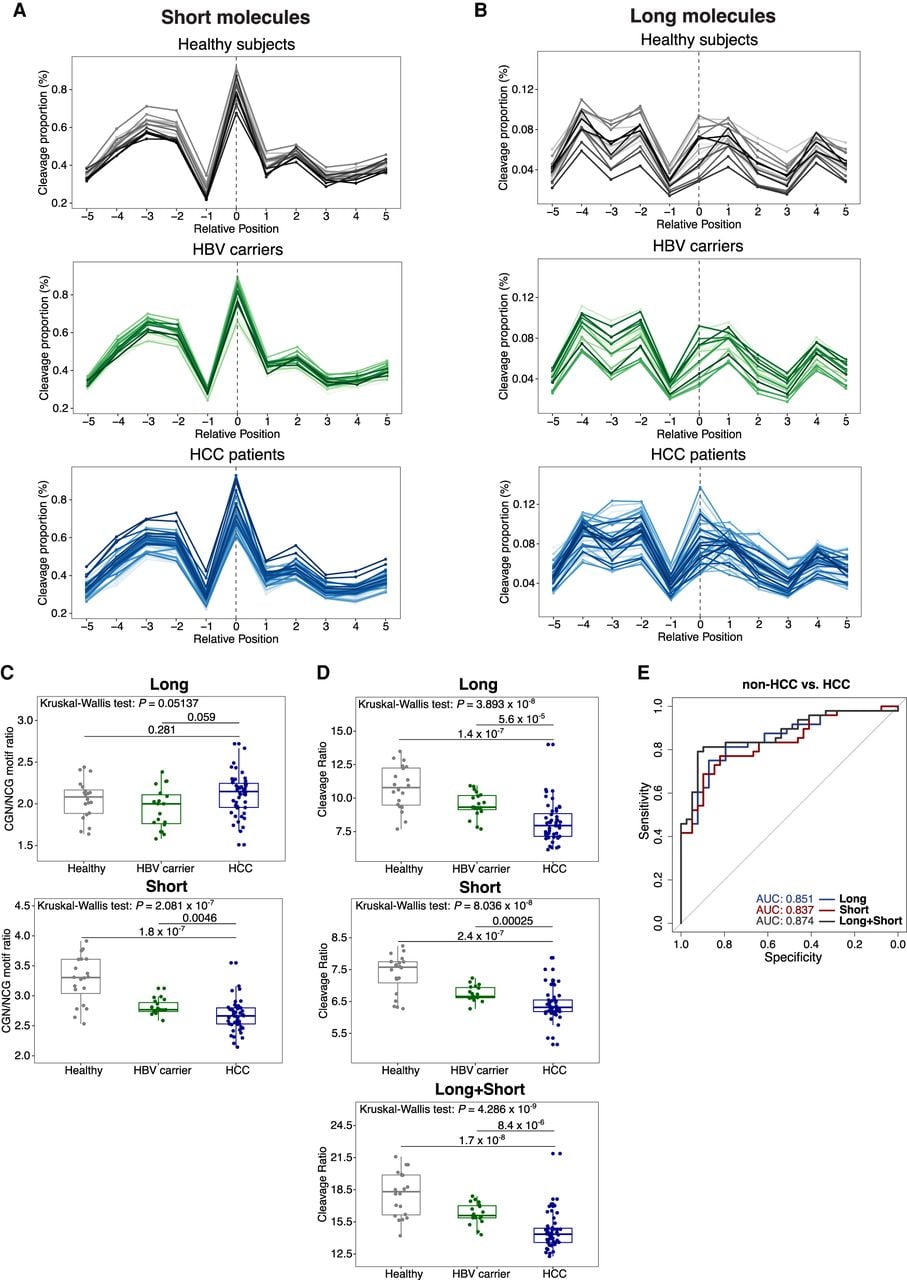
Figure 5.
Cleavage profiles of long and short molecules surrounding CpGs. (A,B) Cleavage profiles surrounding all autosomal CpGs for short (A) and long (B) cfDNA molecules. Each line represents one sample. A cleavage window of 11 bases is shown. Positions 0 and 1 indicate cytosine and guanine, respectively. (C) Box plot of CGN/NCG motif ratios for long and short molecules. (D) Box plot of cleavage ratios between aggregating positions −4, −2, 1, and 4 and position −1. (E) AUCs for distinguishing patients with HCC from non-HCC subjects using the cleavage ratios in D. P-values of differences among groups by Kruskal–Wallis tests. Post hoc pairwise P-values by Wilcoxon rank-sum tests with Benjamini–Hochberg adjustment shown above horizontal lines (C,D).