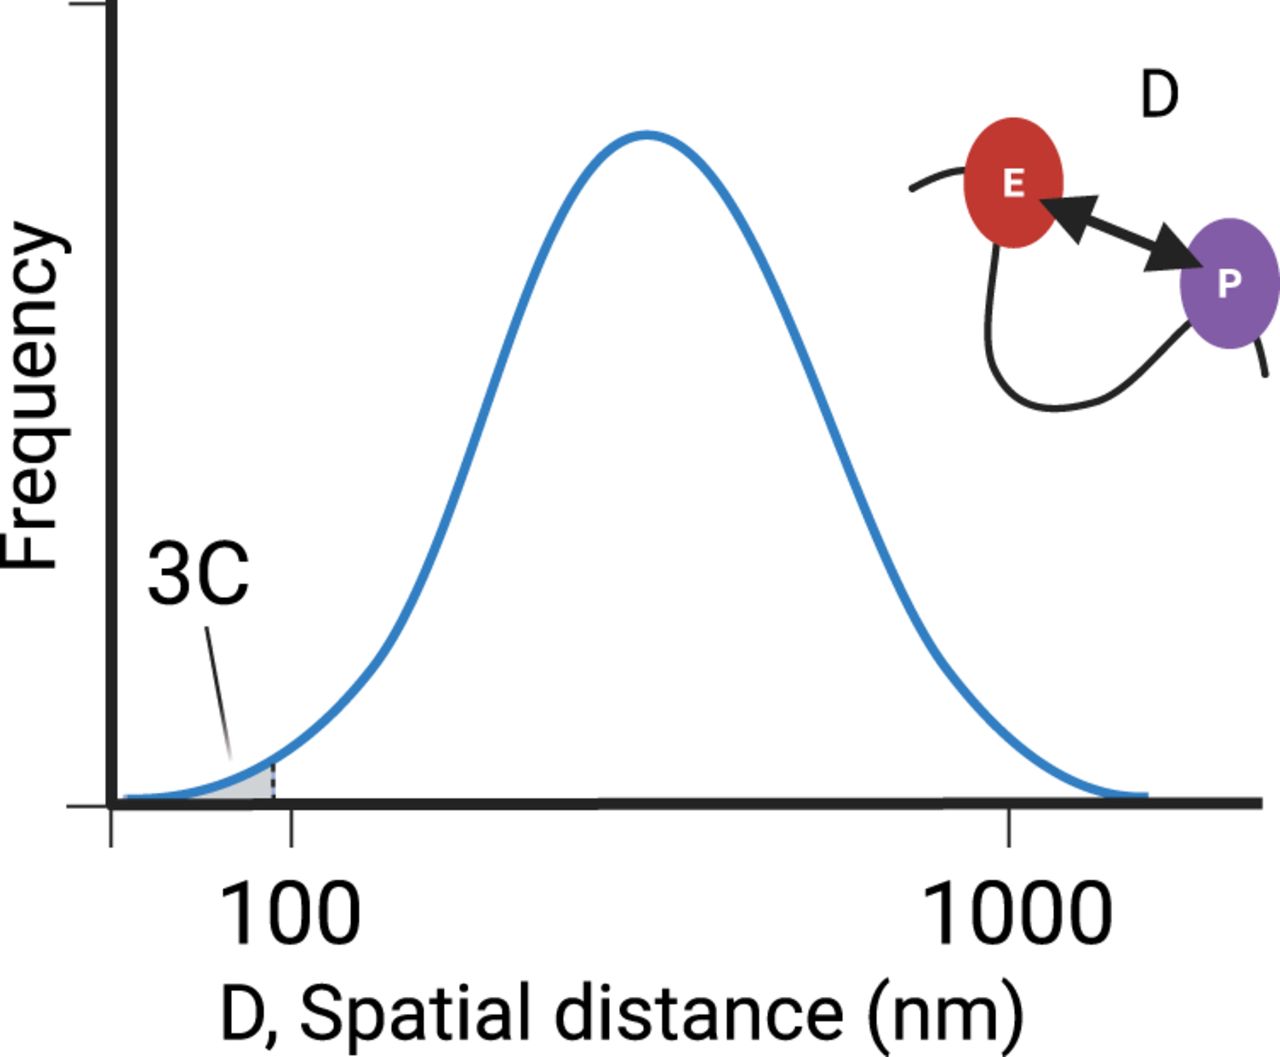
Figure 3.
Enhancer promoter distance measurements. The probability density function (PDF) represents the distribution of distances between candidate promoter–enhancer pairs. Imaging methods can theoretically measure the entire distribution, whereas 3C-based methods only measure the lower tail. Distribution drawn based on data from Chen et al. (2018). (Created in BioRender. Danko, C. [2025] https://www.biorender.com)