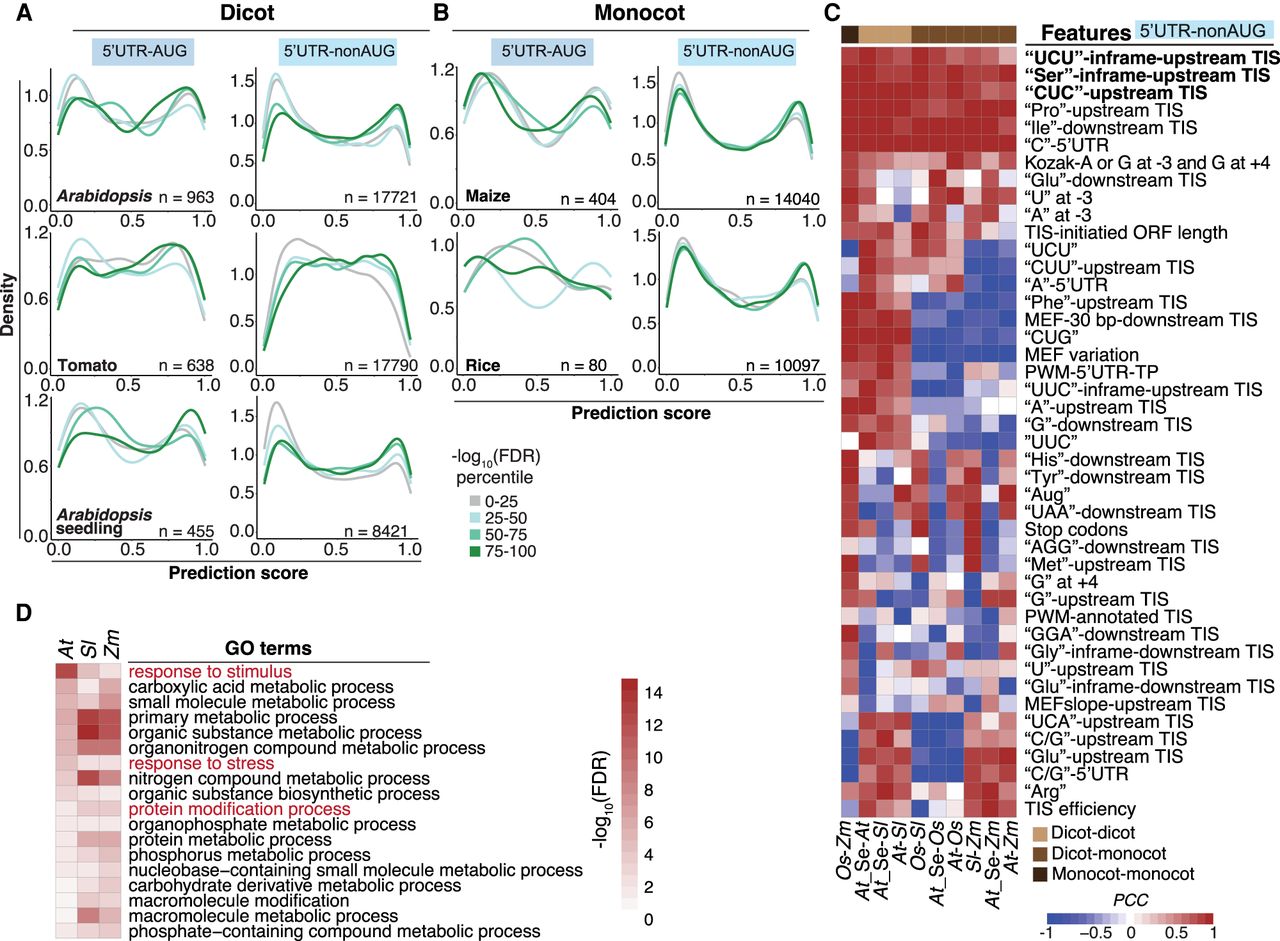
Prediction of monocot and dicot TISs and their characteristics. (A) Distribution of the TIS prediction scores generated by the tomato best models for the 5′ UTR–AUG and 5′ UTR–nonAUG TIS groups identified by the RiboTISH algorism and with RiboTISH-reported FDRs (FDR percentile in which the 0–25 category includes TISs with lowest FDR values) using ribosome profiling data sets generated from dicot plants including Arabidopsis (suspension cells), tomato (leaves) and Arabidopsis seedings. (B) As indicated in A, but for the data sets generated from monocot plants including maize and rice. (C) Pairwise Pearson correlation coefficient of the features among dicot and monocot plants for the 5′ UTR–nonAUG TISs identified by the RiboTISH algorism. Monocots: (At) Arabidopsis, (Sl) tomato, and (At-Se) Arabidopsis seedlings; monocots: (Zm) maize and (Os) rice. (D) GO biological process terms significantly enriched (FDR < 0.05) in genes that have RiboTISH-reported TISs with the top 10% highest prediction scores and with the top 25% highest CG contents in the upstream 100-bp regions.