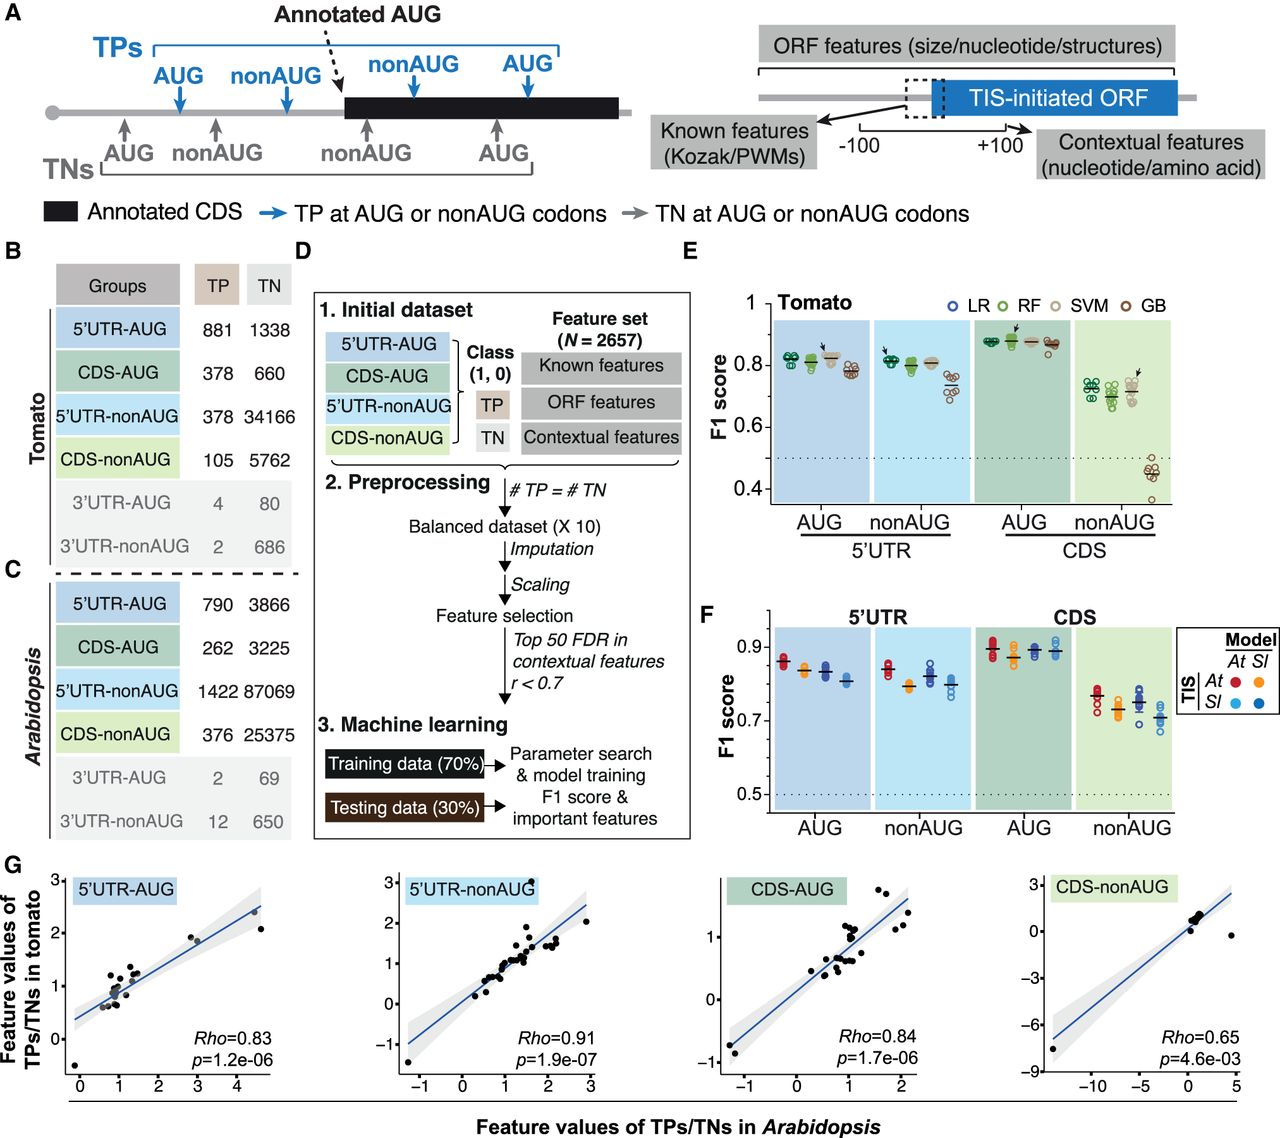
Identification of prediction models and the associated features that predict plant alternative translation initiation sites (TISs). (A) Illustration of the identified true-positive (TP; blue) and true-negative (TN; gray) TISs that were categorized based on the location of initiation codons (i.e., 5′ UTR, CDS, or 3′ UTR) and their sequences in a transcript. The “known” features include the Kozak motif and position weight matrices (PWMs) generated from short sequences centered on TISs (Joshi et al. 1997; Reuter et al. 2016). The “ORF” features consist of various nucleotide compositions/sizes of the alternative TIS-initiated open reading frames (ORFs) and the annotated ORFs and also the RNA structures/nucleotide compositions of their surrounding regions. The “contextual” features based on k-mer enrichment analyses (k = 1–3) consist of the nucleotide and amino acid sequence contexts in the 200-bp region centered on the TISs (see the Supplemental Methods). Gray line indicates mRNAs; black boxes, annotated AUG TIS-initiated ORFs; and blue boxes, alternative TIS-initiated ORFs. (B,C) Numbers of the identified TP and TN TISs, categorized as described in A, in the tomato (B) and Arabidopsis (C). (D) Machine-learning (ML) workflow used to identify prediction models and the features that were informative for predicting TISs (see the Supplemental Methods). The Pearson correlation coefficient (r) and the false-discovery rate (FDR; determined by Wilcoxon rank-sum test) represent the correlation and the statistical significance of differences for the feature values between TP and TN TIS sets. “Top 50 FDR in contextual features” represents that the 50 contextual features with smallest FDRs were selected for further analysis (see the Supplemental Methods). The F1 score is the harmonic mean of precision and recall, which ranges from zero to one with one indicating a perfect model. (E) The prediction performance (represented as F1 scores) when all features (i.e., the known/ORF/contextual ones) were applied in predicting the four tomato TIS groups. A circle indicates the performance of a model with a given combination of model parameters in a randomly balanced TP and TN data set. A black line indicates the mean of the F1 scores for a given ML algorithm. An arrow indicates the best model (i.e., for the ML algorithm with highest mean performance, the model with highest F1 score). A dashed line indicates the baseline performance expected by random guessing. (F) The cross-species and within-species prediction performance (shown as F1 score) when using the best model built in one species to predict the TISs in another species (light blue and orange) and to predict the TISs within the same species (red and dark blue). Results are shown for the four TIS groups in the tomato and Arabidopsis. (G) The mean of the fold changes for the feature values between TP and TN TIS sets among 10 randomly balanced data sets. Rho indicates Spearman's rank correlation coefficient. The black line indicates the fitted linear regression line, and the gray area indicates the 95% confidence interval. To exclude the possibility of bias arising from 5′ UTR lengths, the lengths of 5′ UTR for genes with and without 5′ UTR–AUG and 5′ UTR–nonAUG are shown in Supplemental Figure S14.