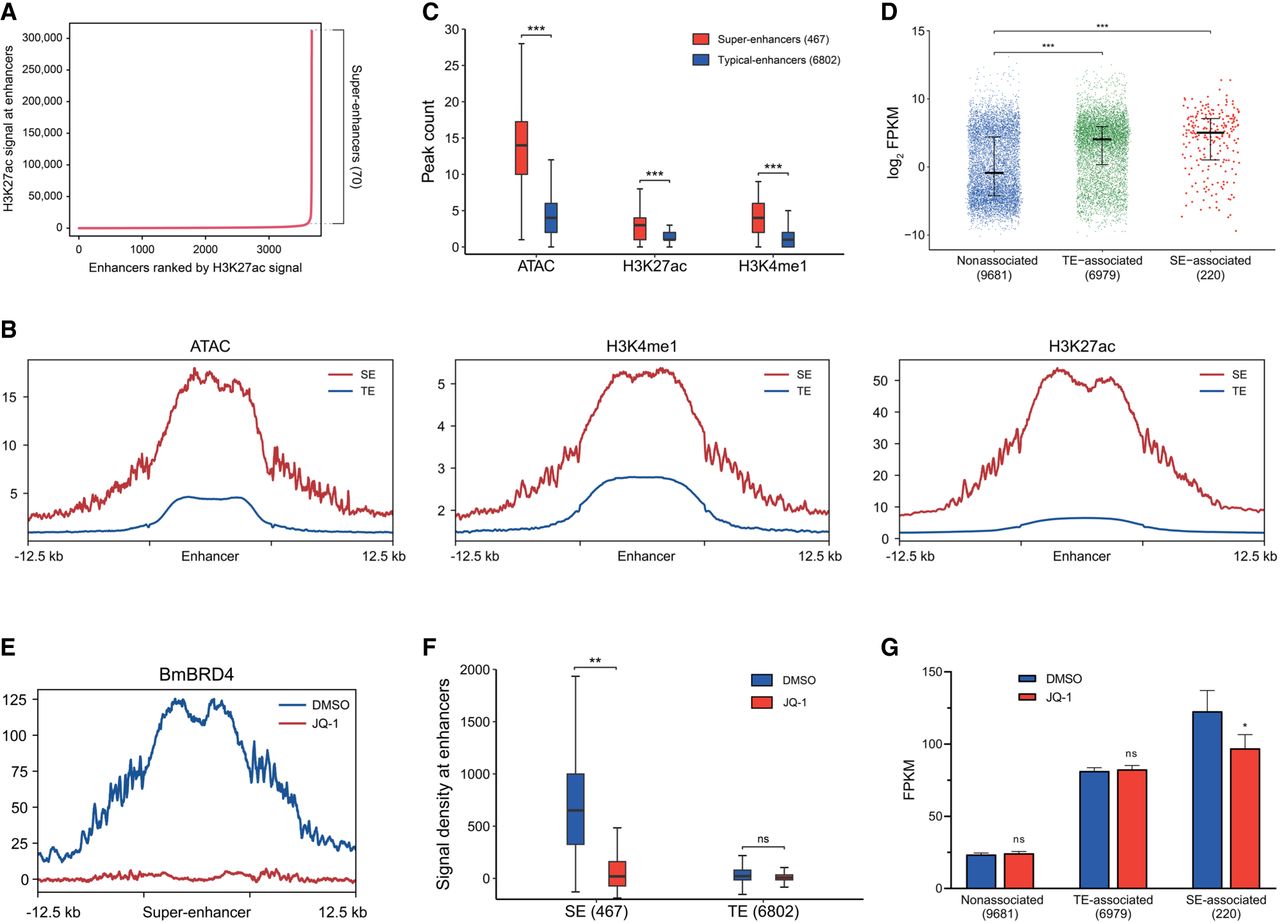
Identification and characterization of super-enhancers (SEs). (A) Distribution of H3K27ac ChIP-seq signal across the enhancers. H3K27ac occupancy is not evenly distributed across the enhancer regions, with a subset of enhancers (70 SEs) containing exceptionally high amounts of H3K27ac signal. (B) Enrichment of chromatin accessibility and enhancer marks around the identified SEs (red) and typical-enhancers (TEs; blue). (C) Peak count of chromatin accessibility and enhancer marks at the identified SEs (red) and TEs (blue). Box plots indicated the median (center of box), lower and upper quartiles (bounds of box), and minimum and maximum values (bars). Two-tailed Wilcoxon rank-sum test: (***) P < 10−15 versus TEs. (D) FPKM of all the nonassociated, TE-associated, and SE-associated genes. The plotted data of each gene were represented by the average FPKM of the gene calculated from the RNA-seq results of three independent libraries. Error bar indicates the median (center of bar) and lower and upper quartiles (bars). Two-tailed Wilcoxon rank-sum test: (***) P < 10−15 versus nonassociated genes. (E) Enrichment of BmBRD4 around the identified SEs in DMSO-treated (blue) or 0.5 μM JQ1-treated (red) cells. DMSO treatment was served as the control. (F) Signal density of BmBRD4 ChIP-seq at the identified SEs and TEs in DMSO-treated (blue) or 0.5 μM JQ1-treated (red) cells. DMSO treatment was served as the control. Box plots indicated the median (center of box), lower and upper quartiles (bounds of box), and minimum and maximum values (bars). Two-tailed t-test: (**) P = 0.003418 versus the control. (G) FPKM of all the nonassociated, TE-associated, and SE-associated genes in DMSO-treated or 0.5 μM JQ1-treated cells. DMSO treatment was served as the control. The plotted data of each gene were represented by the average FPKM of the gene calculated from the RNA-seq results in three independent libraries. Error bar indicates the SE. Paired t-test: (*) P = 0.04245 versus the control.