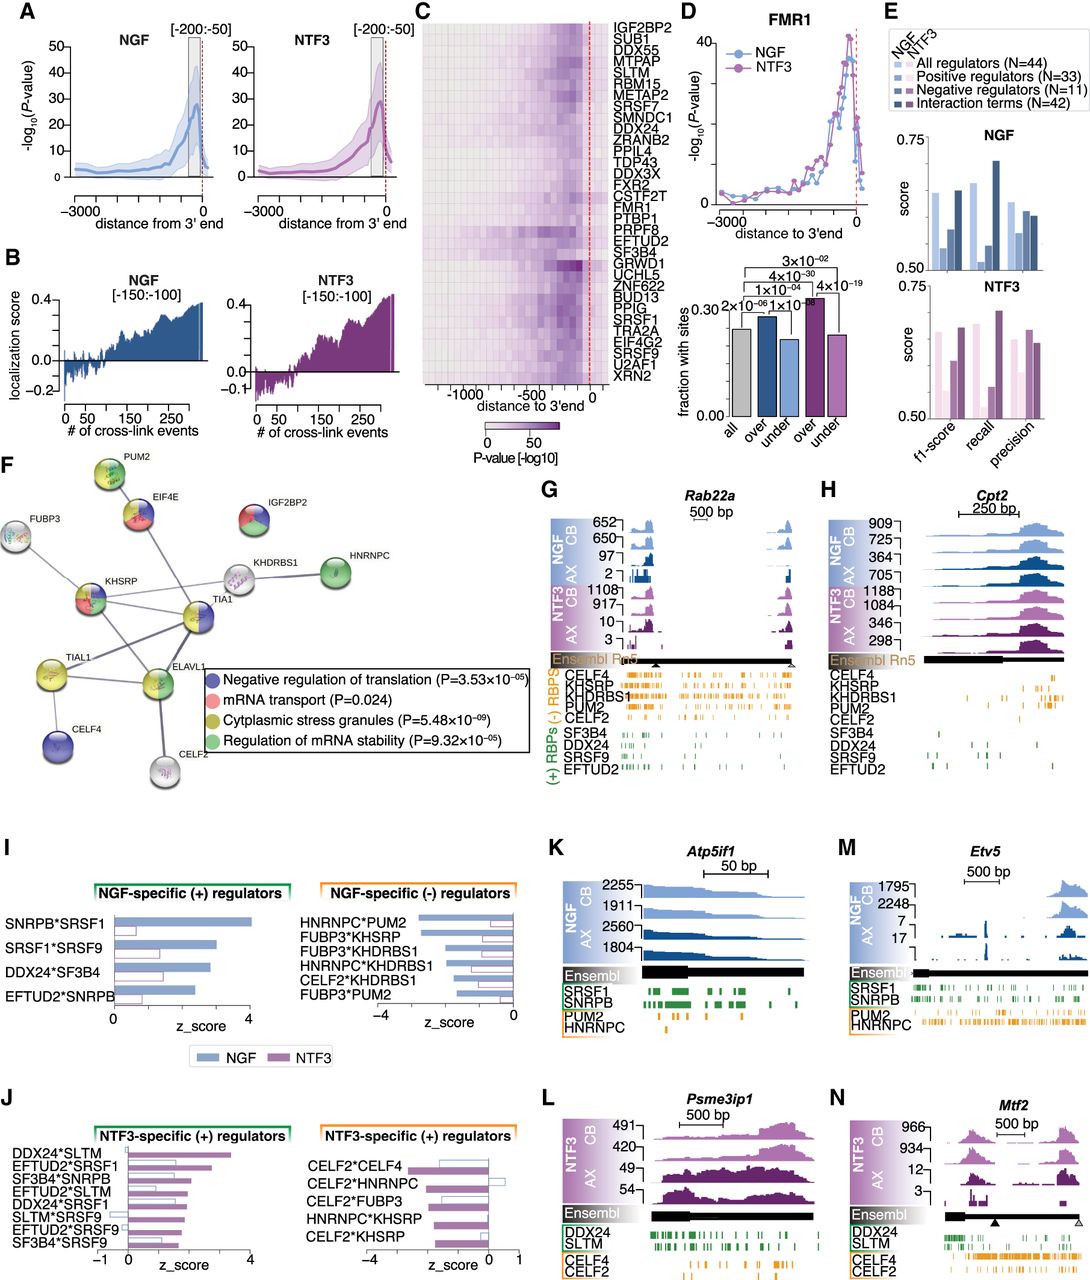
The RBP regulome underlying axonal transcript localization in NGF and NTF3. (A) Distribution of the significance in the difference between the mean LSs in NGF (left) and NTF3 (right) of the isoforms showing or not a cross-link event in 50-nt-long regions along the 3′ UTR for 126 RBPs. Dark line displays the median; shaded areas, lower and upper quartiles. (B) Increasing LSs in NGF (left) and NTF3 (right) conditions as a function of the running average of detected number of cross-link events across the 332 CLIP-seq data in the [−150:−100]-nt upstream of the 3′ end. (C) Heatmap showing the significance in the difference between the mean LSs of the 3′ UTR isoforms showing or not a cross-link event in 50-nt-long regions along the 3′ UTR for the top 32 RBPs positively associated with axonal localization. (D) Scatterplot of the extent of significant association between FMR1 cross-link events and the axonal localization along the 3′ UTR (top). Blue indicates NGF; purple, NTF3. (Bottom) Barplots showing the fraction of [−250:−50]-nt regions upstream of the 3′ ends showing a FMR1 cross-link event in the full set of detected transcripts (gray bar) and the pools of over- and undertransported transcripts in NGF (blue bars) and NTF3 (purple bars), respectively. Fisher's enrichment test. (E) Logistic regression classifier performances trained with different feature sets: all regulators (43 RBPs; M1), positive regulators only (32 RBPs; M2), negative regulators only (11 RBPs; M3), and interaction terms (pairs of RBPs; M4) for the NGF data set (top) and NTF3 data set (bottom). (F) Protein–protein interactions for 16 predicted negative RBPs showing significant enrichment in cross-link events in the [−250:−50]-nt regions upstream of the 3′ end of the undertransported transcripts. Edges represent experimentally determined protein–protein interactions annotated in the STRING database. Nodes indicate proteins colored according to biological pathways they are enriched in. (Inset) Top four biological pathways and associated enrichment P-values as obtained from a Fisher's enrichment test. (G,H) Genome browser view of representative transcripts either restricted (G) or with significant detection in the axonal compartment (H) in NTF3-treated and NGF-treated culture conditions and CLIP cross-linking events for the most-negative (orange) and most-positive (green) RBP regulators of axonal transport common to NGF and NTF3 conditions. (I,J) Barplot showing the significance in features importance to logistic regression classifier performance of pairs of RBPs that are specific to NGF (I) or NTF3 (J). (K–N) Similar to G for transcripts over- and undertransported in the NGF condition (K,M) and over- and undertransported in the NTF3 condition (L,N) (see also Supplemental Fig. S5J).