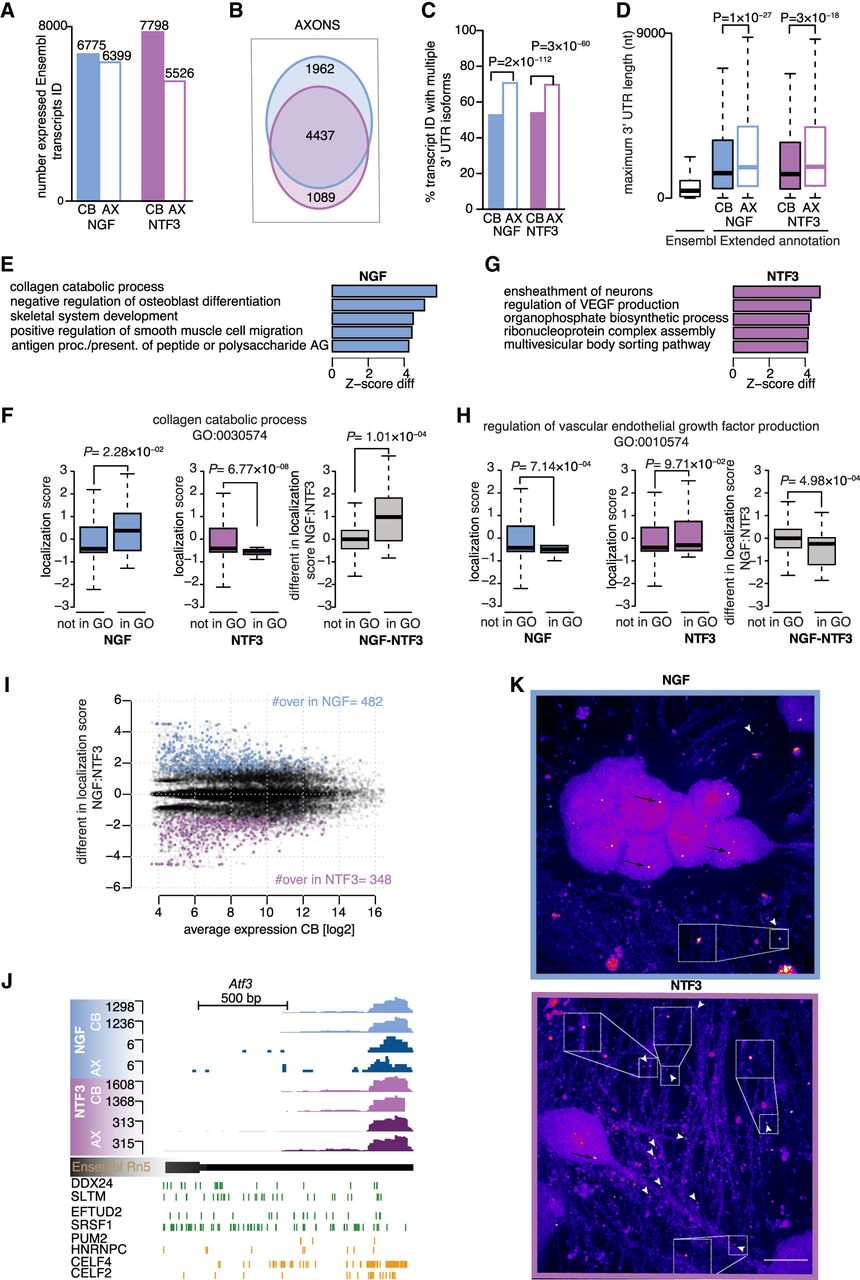
Axons exposed to NGF or NTF3 contain distinct 3′ UTR isoforms. (A) Number of Ensembl transcripts ID detected in cell bodies only (filled-in bars), and cell bodies and distal axons (empty bars) in NGF (blue) and NTF3 (purple) culture conditions. (B) Overlap between the transcripts detected in the distal axons of neurons exposed to either NGF or NTF3. (C) Cell body (filled-in bars) and axonal (empty bars) transcript IDs showing multiple 3′ UTRs in either NGF or NTF3 culture conditions. Two-sided Fisher's exact count test. (D) Maximum 3′ UTR lengths for existing annotations in Ensembl Rn5 (Ensembl) and for those newly identified by 3′ end RNA sequencing (extended annotation) in either NGF or NTF3. Two-sided Wilcoxon rank-sum test. (E) Top five GO biological pathways with associated transcripts showing the most significant increase in axonal localization in NGF (left) compared with NTF3 (right), as quantified with standardized scores comparing GO-annotated transcript with the full pool of detected transcripts (Z-score). (F) Distributions of the localization scores (LSs) for the background genes and the genes belonging to the collagen catabolic biological pathway in NGF (left) and in NTF3 (center) and the differences in LSs between the two conditions (right). Welch's t-test assessing the significant difference between the mean LSs. Boxplots display the five number summary of median, lower and upper quartiles, minimum and maximum values. (G) Same as E for the top five GO biological pathways showing excess in axonal localization in NTF3 compared with NGF. (H) Same as F for genes belonging to the regulation of VEGF production. (I) Average mRNA abundance across the four cell bodies samples and the difference in LSs between NGF and NTF3. Four hundred eighty-two transcripts significantly more localized in NGF compared with NTF3 (blue dots; Z-score > 1.96) and 348 transcripts significantly more localized in NTF3 compared with NGF (purple dots; Z-score < −1.96). (J, top) Genome browser view of a representative transcript with significant detection in the axonal compartment in NTF3-treated culture condition and residual detection in NGF condition (Atf3). (Bottom) eCLIP cross-linking events along the gene for NTF3-specific pairs of positive regulators of axonal transport (DDX24:SLTM and EFTUD2:SRSF1; green) and negative pairs regulators of axonal transport specific to NGF or NTF3 (PUM2:HNRNPC and CELF4:CELF2, respectively; orange). (K) Lower levels of Atf3 localized to NGF-treated axons (top) compared with NTF3-treated axons (bottom). Black arrows point to cell body signal; white arrowheads, axonal signal. mRNA puncta were not subject to pixel dilation. (Insets) Magnification (2×) of the boxed areas. Scale bar, 10 μm.