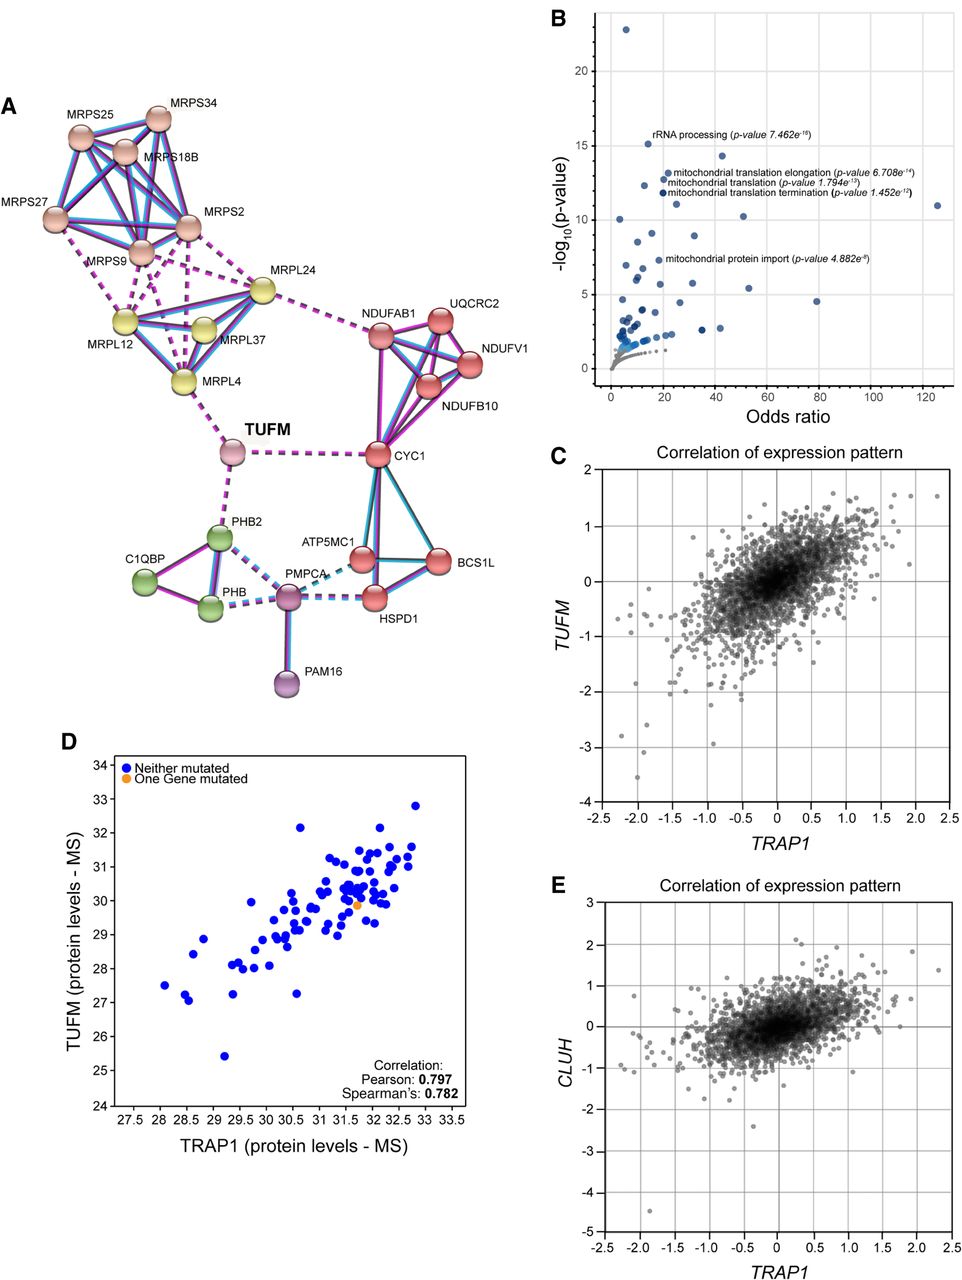
TRAP1 is coexpressed with the mitochondrial translational machinery. (A) Network analysis of the top 100 TRAP1-coexpressed genes, generated by STRING using a Markov cluster (MCL) algorithm. Network nodes represent proteins; edges represent protein–protein associations, by coexpression (black line), experimentally determined association (pink line), or database-curated association (blue line). Edges between clusters are represented by dotted lines. The red cluster is enriched in mitochondrial electron transport components; pink and yellow clusters are constituted by structural component of the mitochondrial ribosome (small and large subunit, respectively); the green cluster contains the mitochondrial prohibitin complex; and the purple cluster is constituted by the association between the mitochondria protein import inner membrane translocase subunit PAM16 and the mitochondrial-processing peptidase subunit alpha PMPCA. (B) Gene set enrichment analysis on the list of genes significantly coexpressed with TRAP1 in human tissues. (C) Coexpression analysis performed with COXPRESdb between TRAP1 and TUFM. (D) Coexpression analysis between TRAP1 and TUFM at protein level according to the Provisional database. (E) Coexpression analysis performed with COXPRESdb between TRAP1 and CLUH.