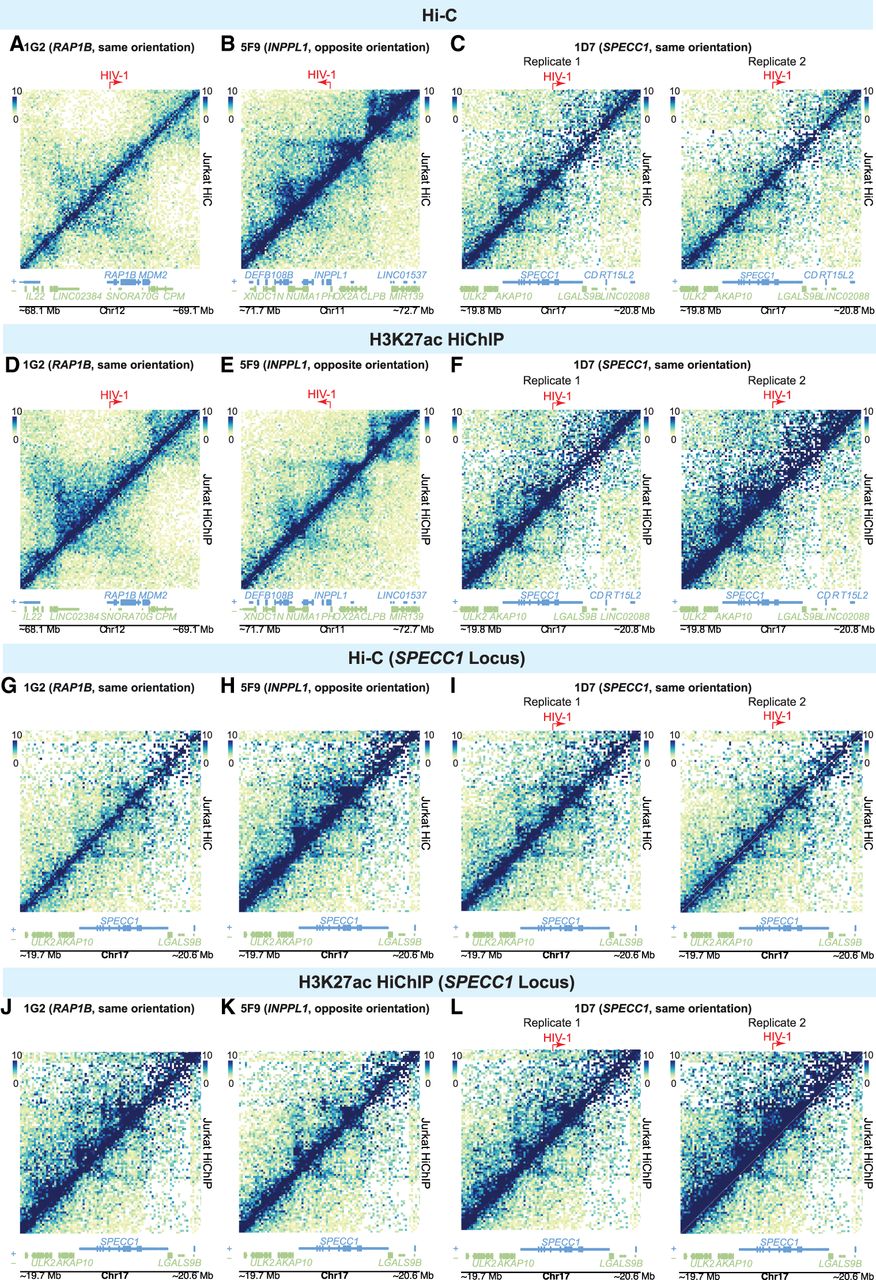
Figure 4.
Impact of HIV-1 on genome-wide 3D chromatin conformation and H3K27ac enhancer loops at the integration site. Heatmap shows Knight–Ruiz (KR) normalized signal at 10-kb resolution surrounding their respective integration sites in Hi-C (A–C) and H3K27ac HiChIP (D–F). Heatmaps showing the Hi-C (G–I) and interaction (J–L) profiles at the same genomic window in lines with no HIV-1 integration into SPECC1 (G,H,J,K) and those with HIV-1 integrated into SPECC1 (I,L).