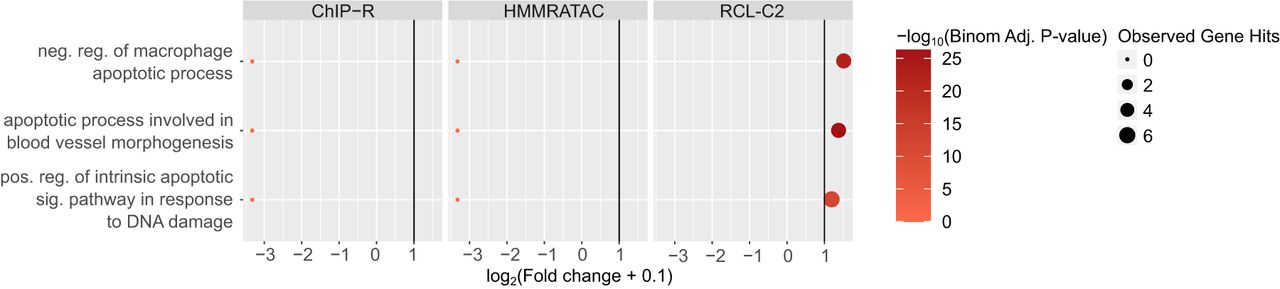
Figure 3.
Gene Ontology analysis using unique peaks called by each method in K562 data. Only relevant terms enriched in at least one peak set are plotted. Colors correspond to −log10(Binomial Adjusted P-value) where the adjustment was done following the Benjamini–Hochberg procedure (Benjamini and Hochberg 1995); dot sizes correspond to the observed number of genes associated with the term; x-axis corresponds to log2(Fold change + 0.1) and vertical line is fold change of two. LanceOtron was not plotted since there was no unique peak called by the tool. (reg.) Regulation, (pos.) positive, (neg.) negative, (sig.) signaling.