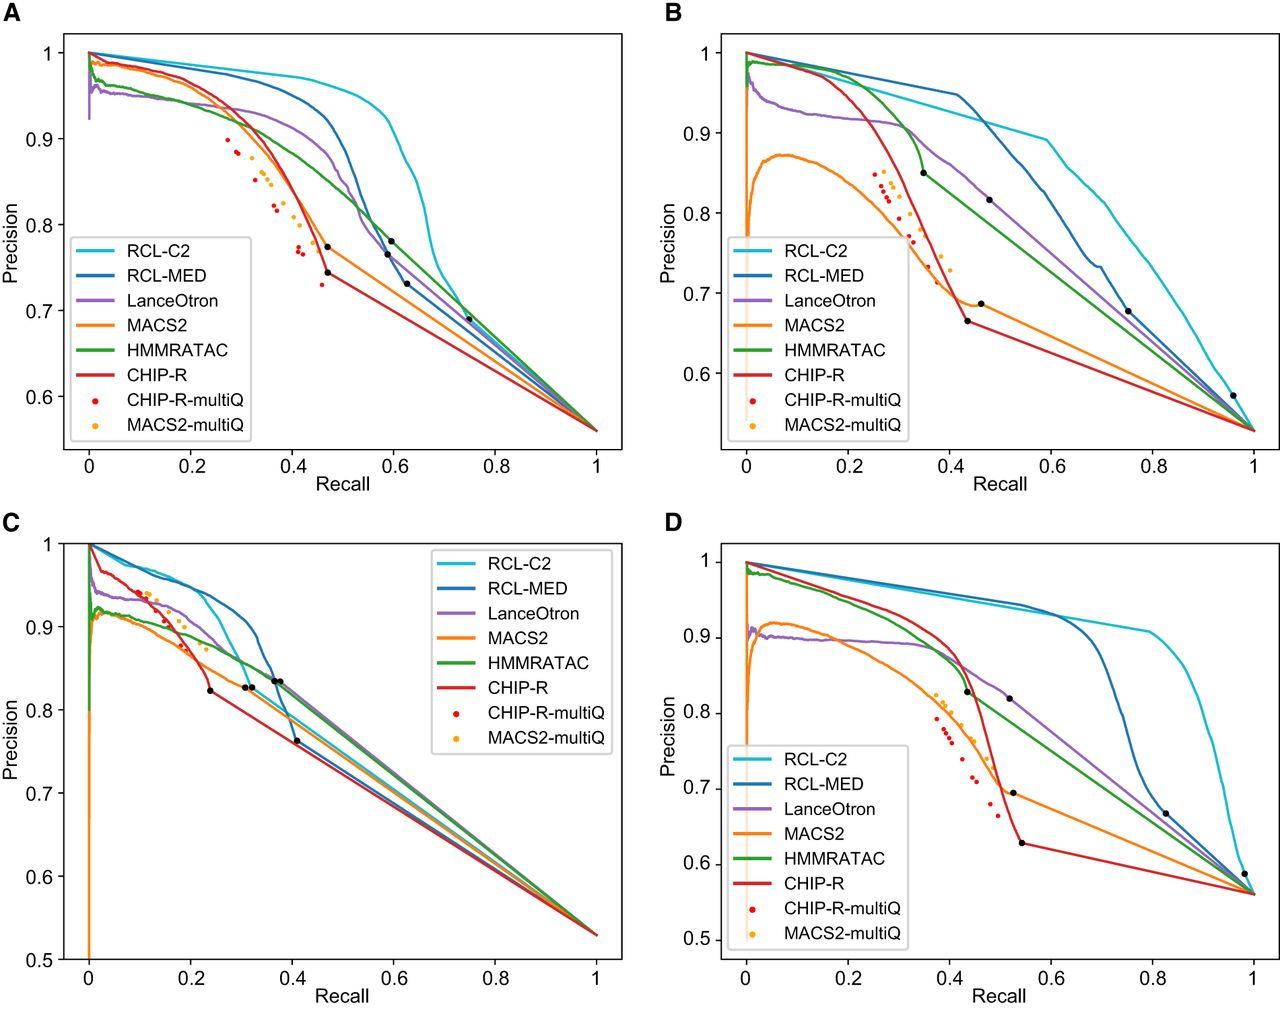
Figure 2.
PR curves for ChromHMM-labeled regions, tested with data sets MCF-7 (A), K562 (B), GM12878 (C), and A549 (D). Black dot in each curve denotes the region with lowest score; all remaining ChromHMM-labeled regions are not scored by the method. RCL-C2, analysis with coverage threshold 2; RCL-MED, analysis with default “median” coverage threshold; MACS-multiQ and ChIP-R-multiQ dots are obtained by varying Q-value cutoffs.