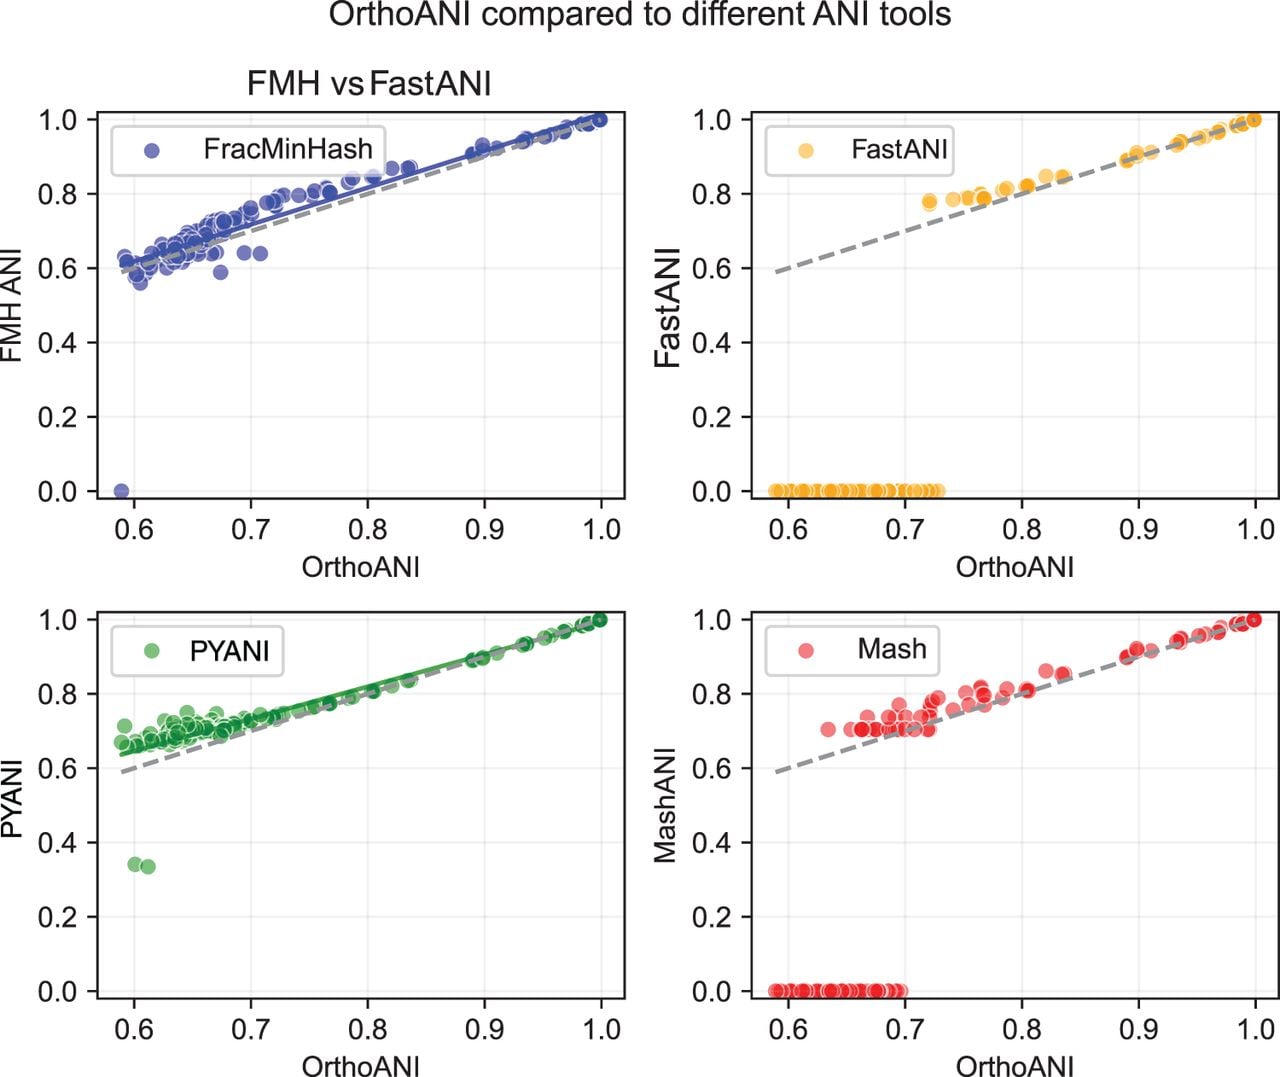
Figure 4.
Pairwise ANI estimation among a selection of genomes from the GTDB database. The dashed line represents ANI computed using OrthoANI. The solid blue and green lines show the least-squares fit for the ANI scores computed using FracMinHash and PYANI, respectively. Mash and FastANI both have many zeroed-out values, and therefore, the least-squares fit is not shown for these two.