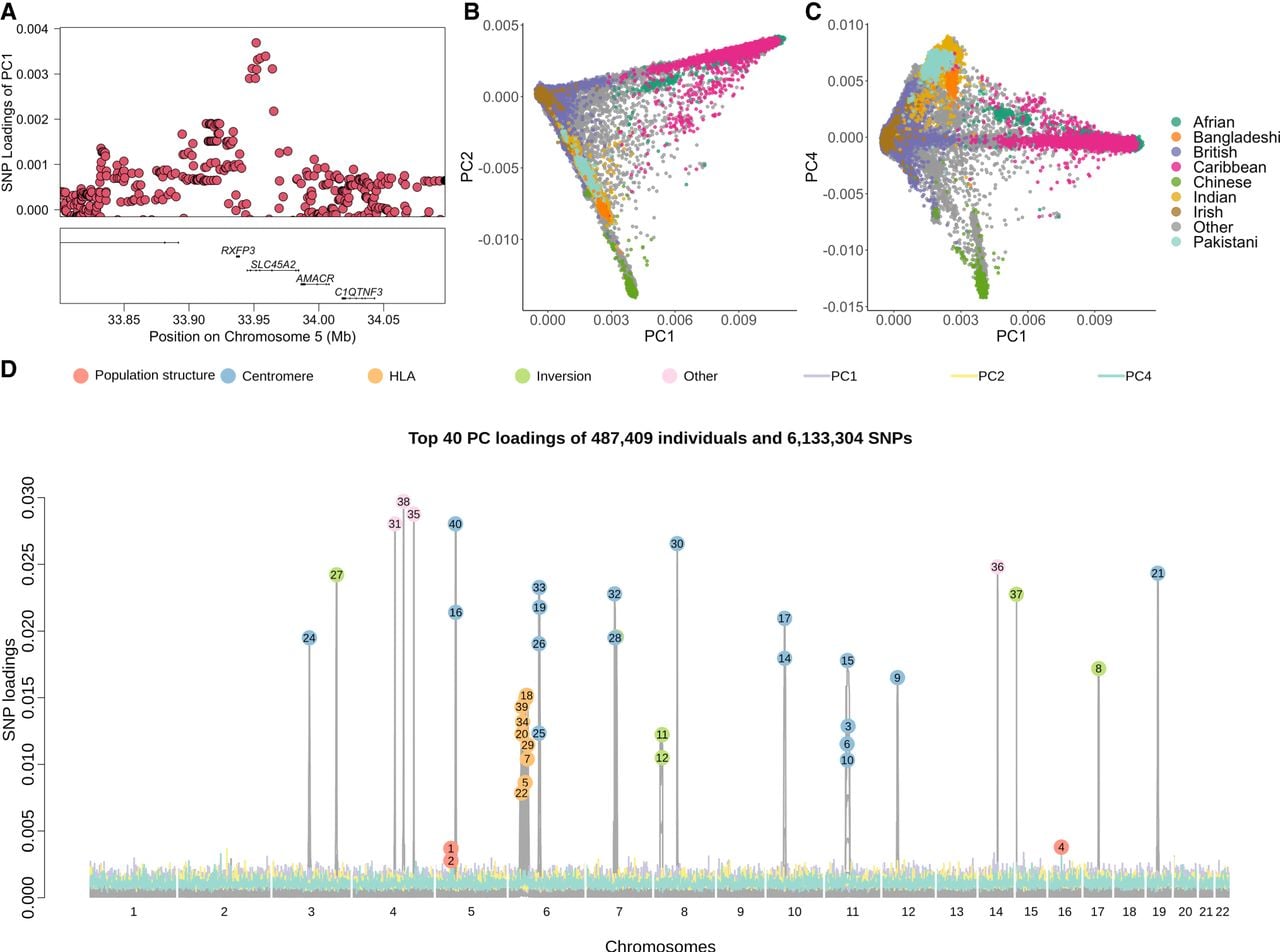
Figure 3.
PCA of the whole UK Biobank imputed data set. (A) LocusZoom of variant rs16891982 with highest loadings for PC1 and PC2. (B,C) Population structure shown in PC1 versus PC2 and PC1 versus PC4 for all 487,409 individuals, colored by country or region label. Other labels are merged into the category “other.” (D) SNP loadings for the top 40 PCs. Peaks are annotated and colored by the type of genomic region in which they are located.