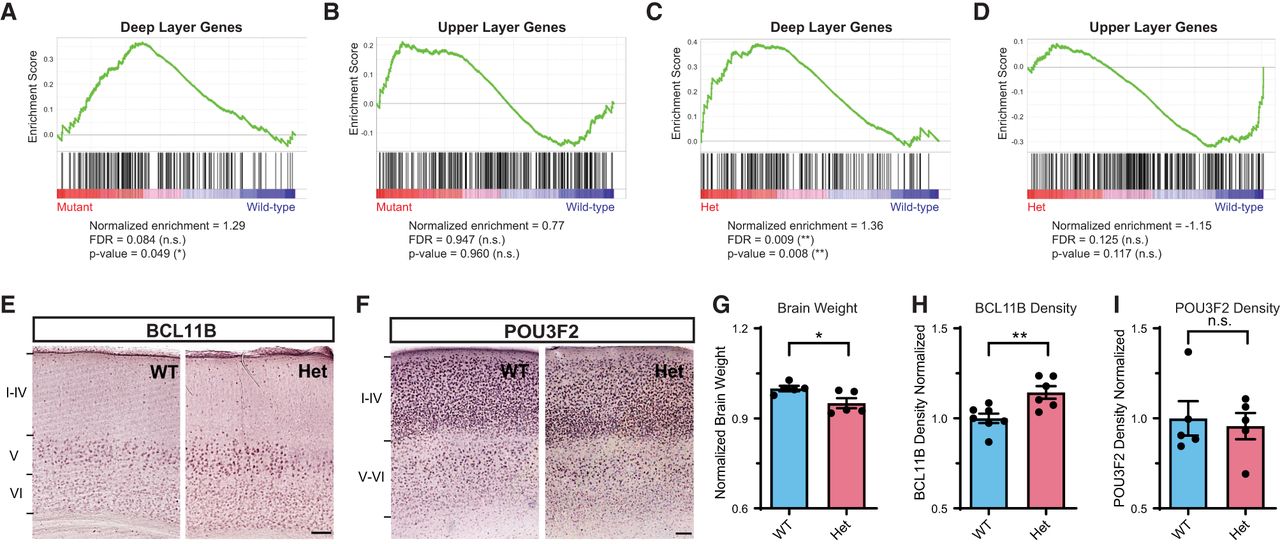
MYT1L controls cortical neuron layer specification. (A) GSEA showed an up-regulation of DL genes in Myt1l mutant E14 CTX. (B) UL genes showed no significant change in Myt1l mutant E14 CTX. (C) GSEA showed an up-regulation of DL genes in Myt1l Het P60 PFC. (D) UL genes showed subtle but not significant down-regulation in Myt1l Het P60 PFC. (E) Representative images of DL neuronal marker BCL11B staining on the P60 mouse cortex. (F) Representative images of UL neuronal marker POU3F2 staining on the P60 mouse cortex. (G) Myt1l Het mice had reduced brain weights compared to WTs. (H) Myt1l Het mice had increased BCL11B+ neuron density in cortex. (I) POU3F2+ neuron density remains the same between Hets and WTs. (*) P < 0.05, (**) P < 0.01. Data were represented as Mean ± SEM. Scale bar, 100 µM.