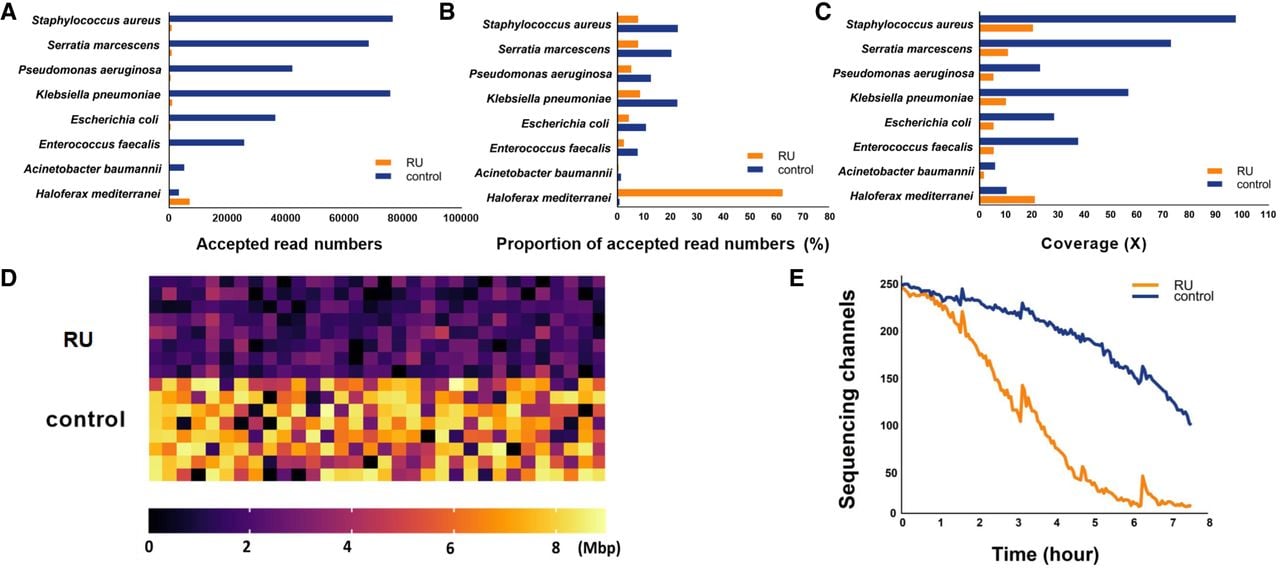
Figure 1.
Enriching low-abundance species in mock community with RU. (A) Bar plot of accepted reads number of the eight microbial species in RU and control runs. (B) Bar plot of the proportion of accepted reads number of the eight microbial species in RU and control runs. (C) Bar plot of the coverage of the eight microbial species’ genome in RU and control runs. (D) Heatmap of data yield per channel in RU and control runs, and (E) plot of the number of sequencing channels over the course of the sequencing run.