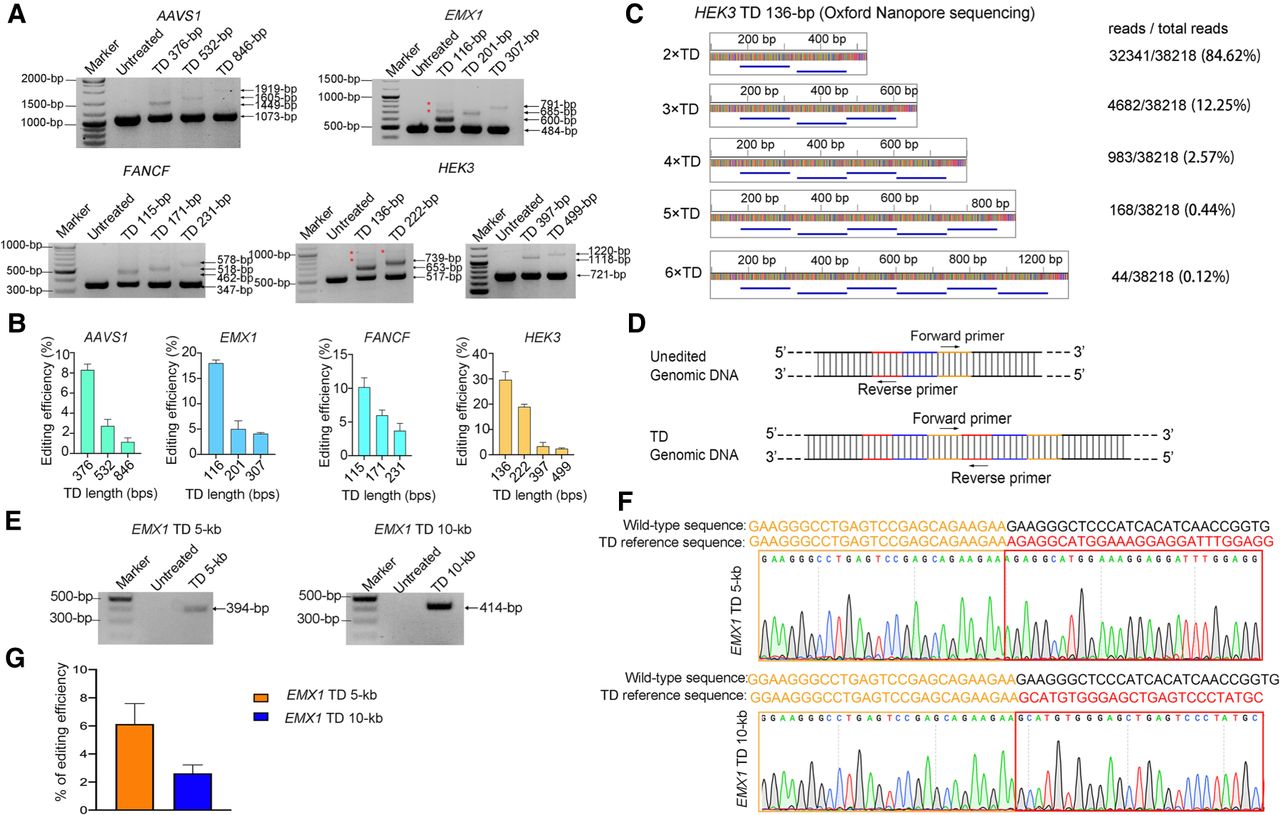
TD-PE generates large fragment TDs at endogenous genomic loci. (A) Agarose gel electrophoresis analysis of the presence of targeted TD on indicated loci. Red stars represent multiple copies of TDs. Sanger sequencing results of targeted TDs were shown in Supplemental Figures S7–S10. (B) Quantification of the efficiencies of the indicated TDs. Values and error bars reflect the mean ± SD of n = 3 independent biological replicates. (C) Different types of TDs in HEK3 TD 136 bp were analyzed by Oxford Nanopore sequencing. Each blue line in the output represents one single copy of the duplications. (D) PCR strategy for detecting the presence of targeted large fragment TDs. A pair of primers were designed for testing kilobase-scale TDs (>5 kb), with forward primers flanking the downstream side of the amplified regions and reverse primers flanking the upstream side of the amplified regions. These primers would specifically amplify the boundary of targeted TDs. The length of the blue fragment was equal to the length that needs to be duplicated minus the red and yellow. (E) Agarose gel electrophoresis analysis of the presence of large fragment TDs in EXM1 loci. Primers used for the detection are listed in Supplemental Table S3. The amplicons with expected sizes are marked by arrows. (F) Sanger sequencing results of PCR products in E. The sequences corresponding to each end of the TD boundary were marked by yellow and red boxes, respectively. (G) Quantifying the frequencies of targeted TDs (EMX1 TD 5 kb/10 kb) by absolute quantitative PCR. The standard curves are shown in Supplemental Figure S24B. The junction fragments of each TD were used to calculate the duplicated allele, and the flanking fragment was used to calculate total allele. Values and error bars reflect the mean ± SD of n = 3 independent biological replicates.