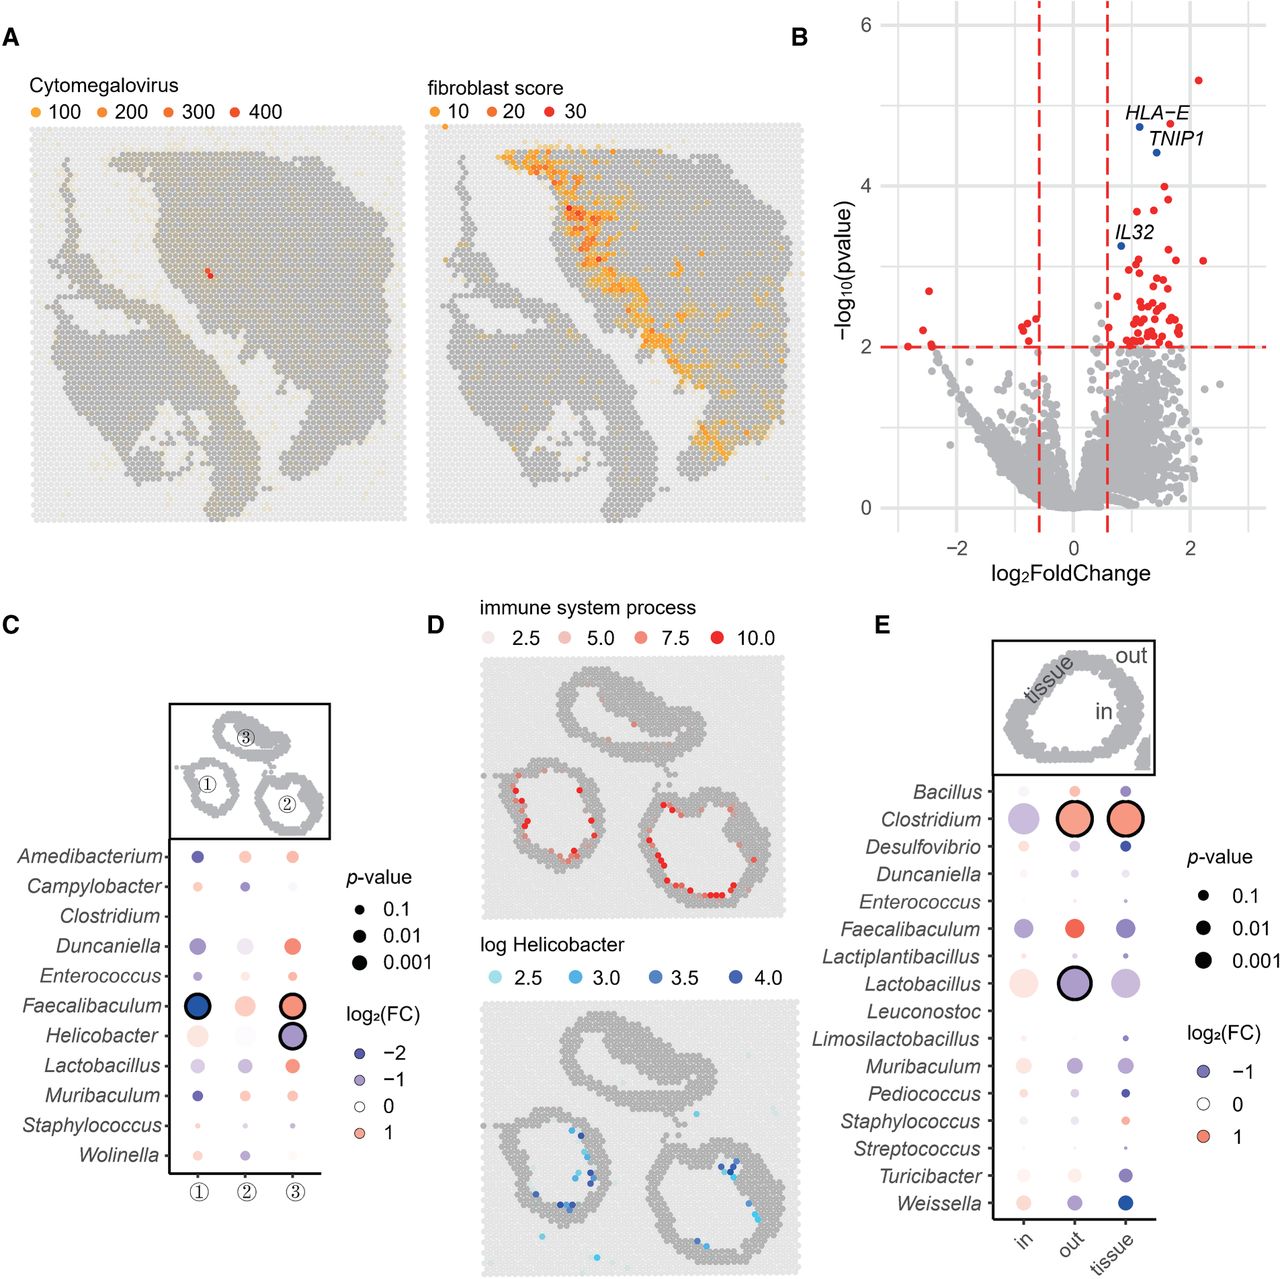
Host–microbe interactions revealed by SMT. (A) Spatial feature plot showing distribution of Cytomegalovirus in patient M1016's section as detected by SMT (left) and distribution of fibroblasts as inferred by its marker gene score (right). (B) Volcano plot showing differentially expressed genes between infected and uninfected fibroblast spots. Highly significant genes (P < 0.01 and |log2FC| > 0.5) were colored red, with several known ones labeled and highlighted in blue. (C) Dot plot showing the fold change and P-value for microbial genera that were differentially distributed in the three sample murine samples as detected by chi-square test, for the mouse large intestine; those with P < 10−8 and |log2FC| > 0.5 were circled. (D) Spatial feature plot showing module score of immune system process (top) and distribution of genus Helicobacter (left). (E) Dot plot showing fold change and P-value for microbial genera that were differentially distributed in the three regions designated “in,” “tissue,” and “out” by chi-square test, for mouse small intestine; those with P < 10−8 and |log2FC| > 0.5 were circled.