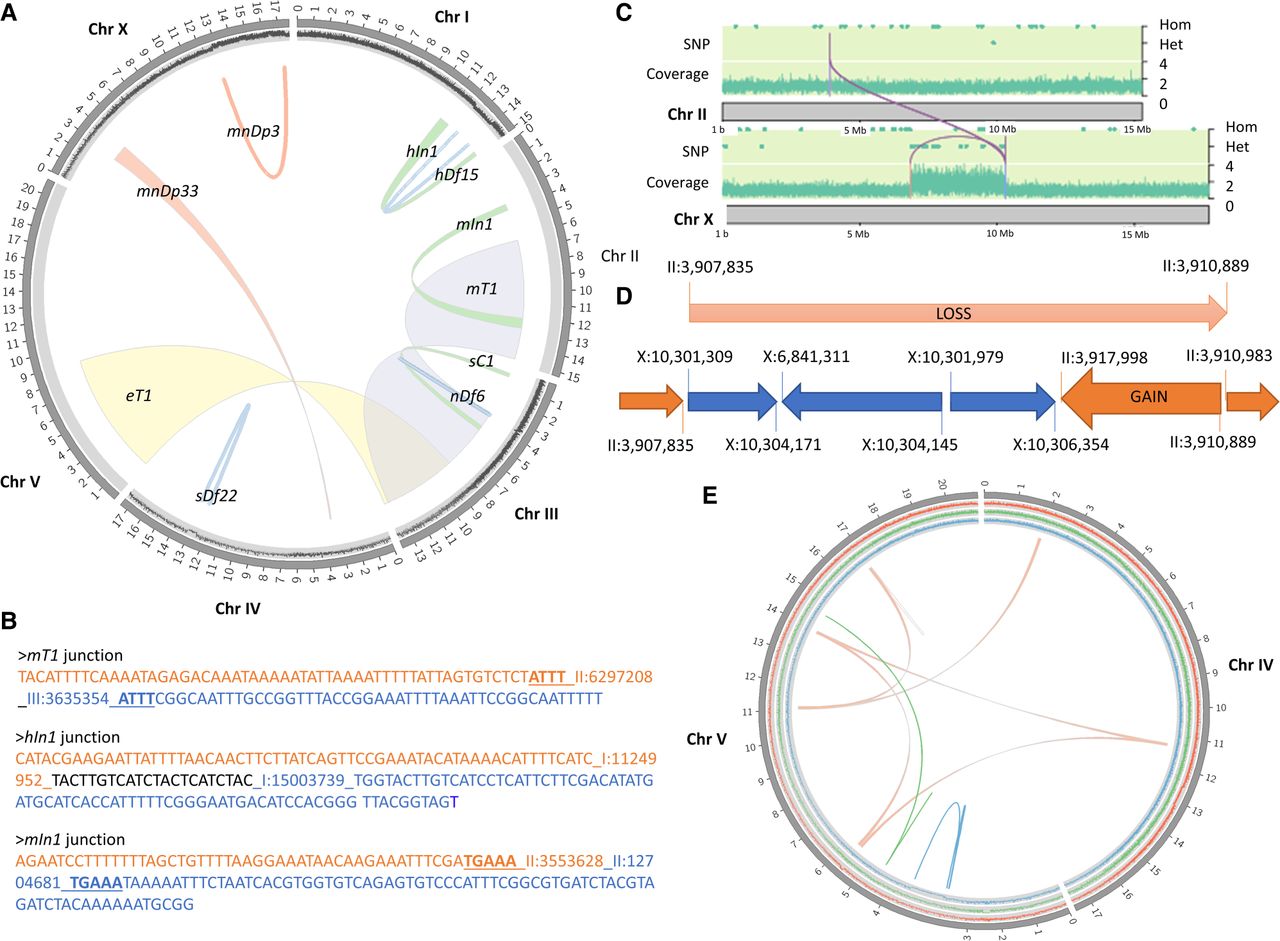
Overview of balancers. (A,B) Single event rearrangements. (A) Circos plot representing the regions affected by single-rearrangement balancers. Green links represent inversions (hIn1, mIn1). Blue links represent deletions (nDf6, sDf22, hDf15). Red links represent duplications (translocated duplication mnDp33 and free duplication mnDp3). Ribbons represent translocations (eT1, mT1). Scatter plots in the outer layer represent the read coverage calculated by window of 1 kb and normalized for KR2839's Chr I, MT690's Chr III, BC1217's Chr IV, and SP123's Chr X. It shows an increase in coverage in case of duplication and a decrease in case of deletion. (B) Breakpoints’ junctions for mT1, hIn1, and mIn1, as confirmed by Sanger sequencing. Orange and blue sequences are from different sides of the junction (different chromosomes for a translocation or different regions of one chromosome in case of inversion). Sequence in black is an inserted sequence at the junction. Bold underlined sequences are potential microduplications at the junction as those bases aligned on both sides of the junction. (C–E) Complex rearrangements. (C,D) stDp2. (C) The graph of the upper layer represents by a dot a single-nucleotide variant (SNV) detected in the RW6002 genome. Dots on the higher layer are homozygous SNVs with two copies of the alternate allele. Dots on the middle layer are heterozygous SNVs with only one copy of the alternate allele. Stretches of heterozygous SNVs suggest that the region is balanced by a complex rearrangement. The coverage graph is a scatter plot representing the read coverage of the genome along the chromosome, calculated by window of 1 kb. The graph shows an increase of read coverage of a short region of Chr X. The purple lines represent the breakpoints detected. (D) Interpretation of the structure of stDp2 based on srWGS analyses. Gain and loss events were detected by coverage analysis only and not supported by split reads, suggesting that they are consequences of the rearrangement, and not the main event. (E) Circos plot representing breakpoints for nT1 (red), eDf43 (blue), and e917 (green).