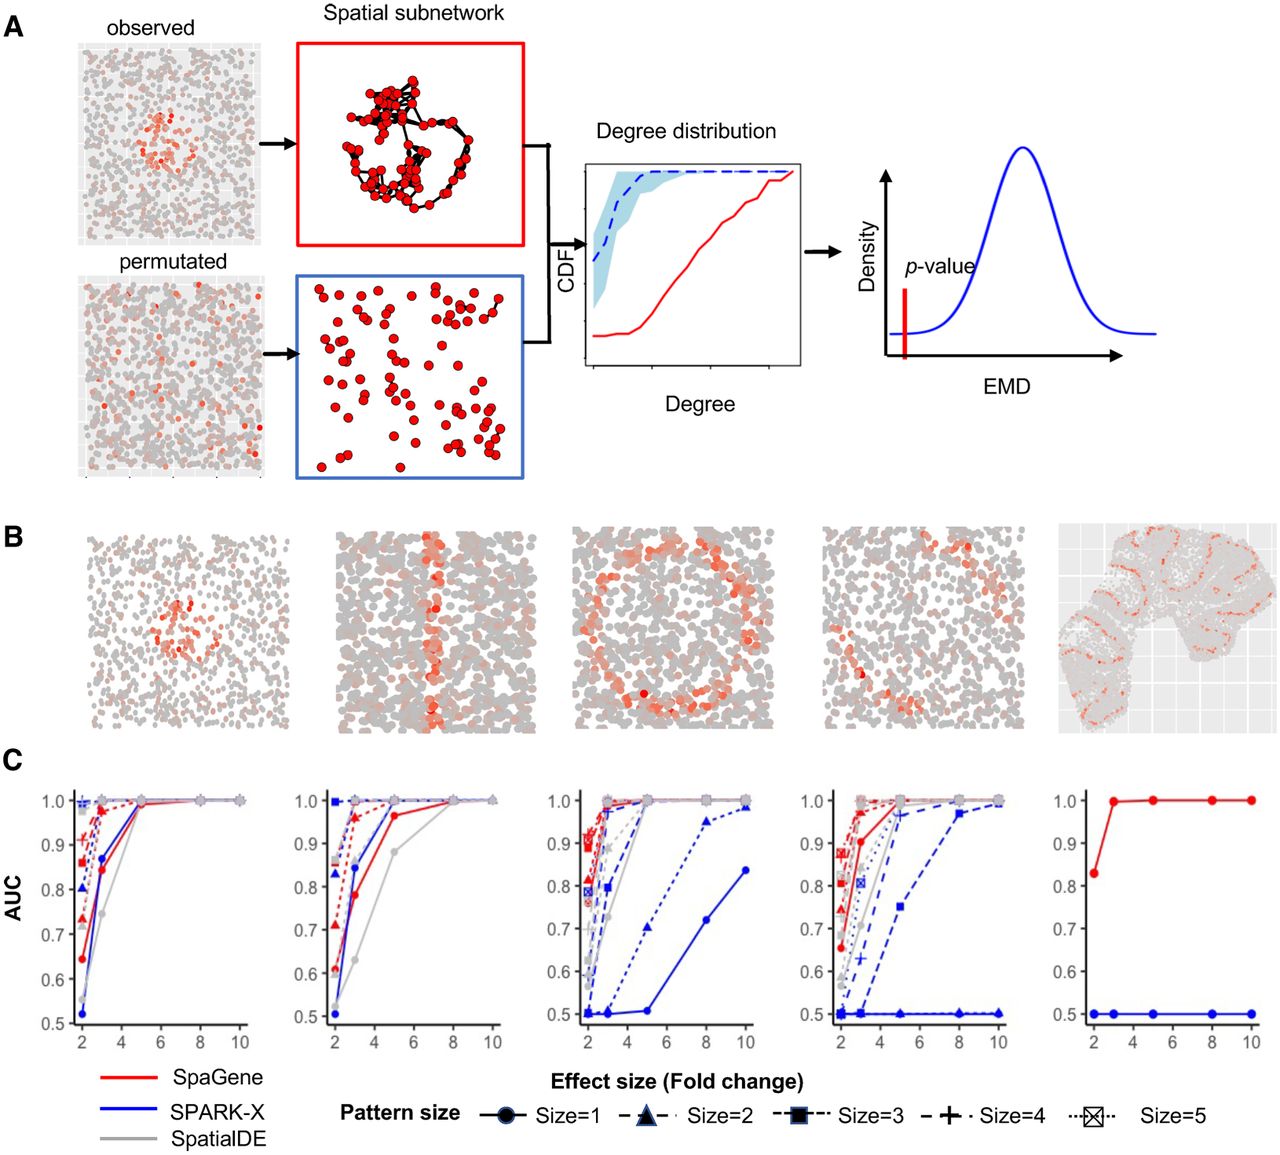
Figure 1.
Schematic of SpaGene and simulation results. (A) Schematic of SpaGene. (B) Visualization of five spatial patterns. (C) Area under the curve (AUC) plots of SpaGene (red), SpatialDE (gray), and SPARK-X (blue) in simulated data sets with different effect sizes (x-axis) and pattern sizes (point shapes) and 10,000 genes and 1000 cells/locations. Simulated data were generated from negative binomial distributions.