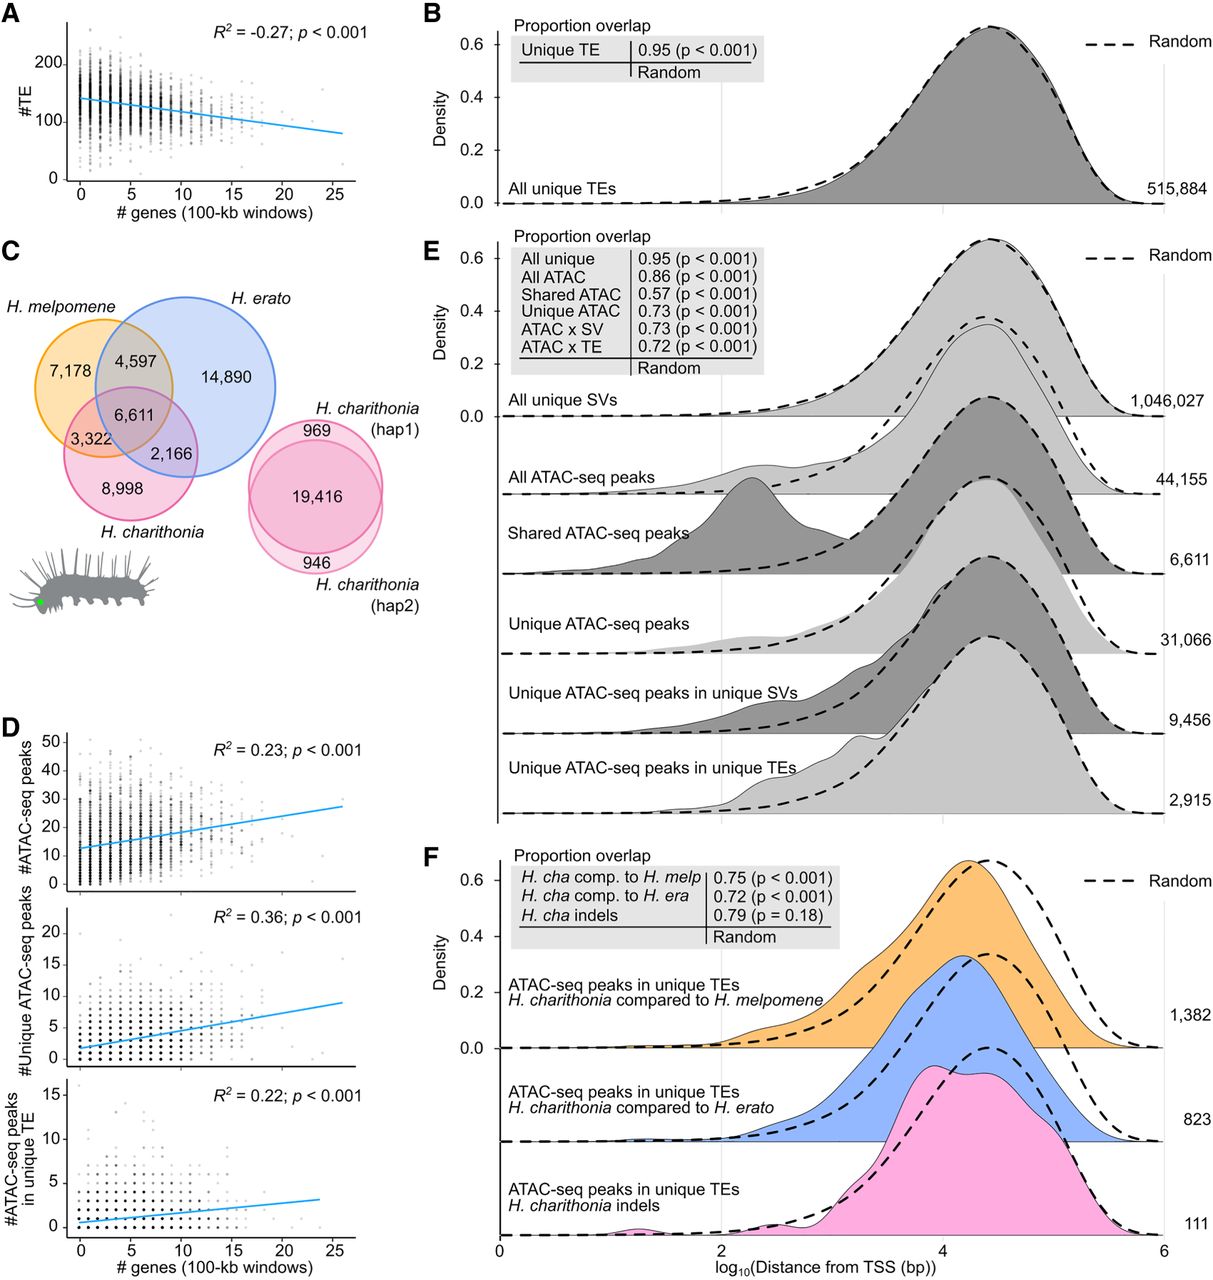
Lineage-specific sequences and their relationship with chromatin accessibility and gene distribution. (A) Correlation of gene density in 100-kb windows with frequency of transposable elements (TEs). (B) Density plot of distance of lineage-specific TEs to closest transcription start site (TSS) pooled over all species genome comparisons. (C) Lineage-specific and shared open chromatin signals (ATAC-seq peaks) found in head tissue of 5th instar caterpillars in each species. Peaks are considered shared (homologous) when they overlap at least 50% reciprocally. (D) Correlation of gene frequency in 100-kb windows with frequency of all lineage-specific structural variants (SVs), all ATAC-seq peaks, lineage-specific ATAC-seq peaks, and lineage-specific TE insertions with ATAC-seq peaks. (E) Density plot of distance of lineage-specific sequence features to closest TSS pooled over all species genome comparisons. We found the distribution of lineage-specific structural variants (SVs) was most similar to a random distribution of positions in the genome (overlapping index = 95%), with a median/mean distance of 21,701/40,790 bp of a lineage-specific sequence and 20,801/39,908 bp of any random position to a TSS. (F) Density plot of distance of lineage-specific TEs with ATAC-seq peaks in H. charithonia to closest TSS. Dashed lines show the distance distribution to TSS of 100,000 randomly selected positions. Tables at the top left in panels B, E, and F report overlapping indexes and pairwise Wilcoxon test P-values between the distributions of lineage-specific sequence features and the random positions. Numbers on the right indicate the number of the respective sequence features.