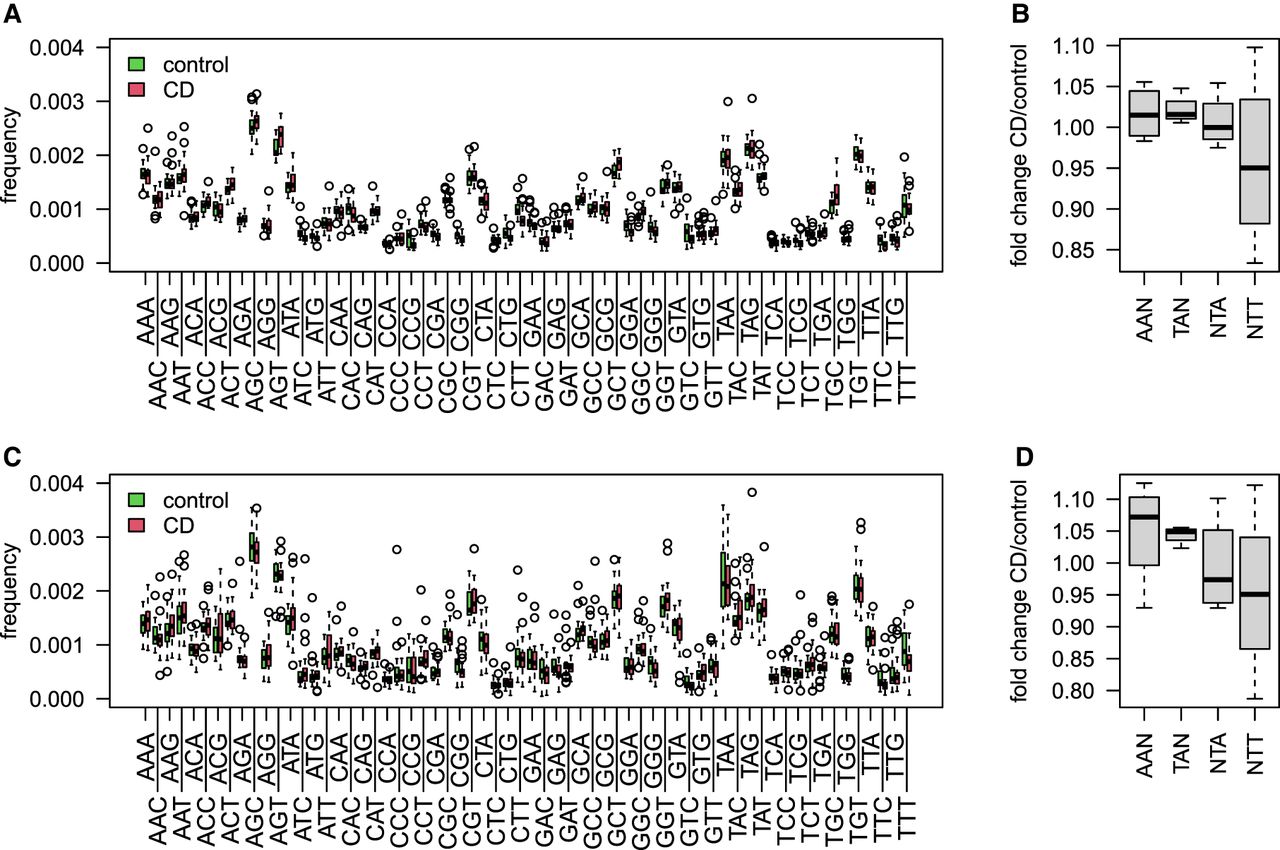
Figure 6.
3-mer mutability model in CD patients compared with the controls. (A) Boxplots showing the frequency of all 3-mer mutability in the RNA-blood samples of individuals with CD compared with the controls. (B) Boxplots showing mutation frequency of individuals with CD normalized to the controls at WA/TW consensus sequences. (C) Boxplots showing the frequency of all 3-mers mutability in the DNA-intestine samples of individuals with CD compared with the controls. (D) Boxplots showing mutation frequency of individuals with CD normalized to the controls at WA/TW consensus sequences.