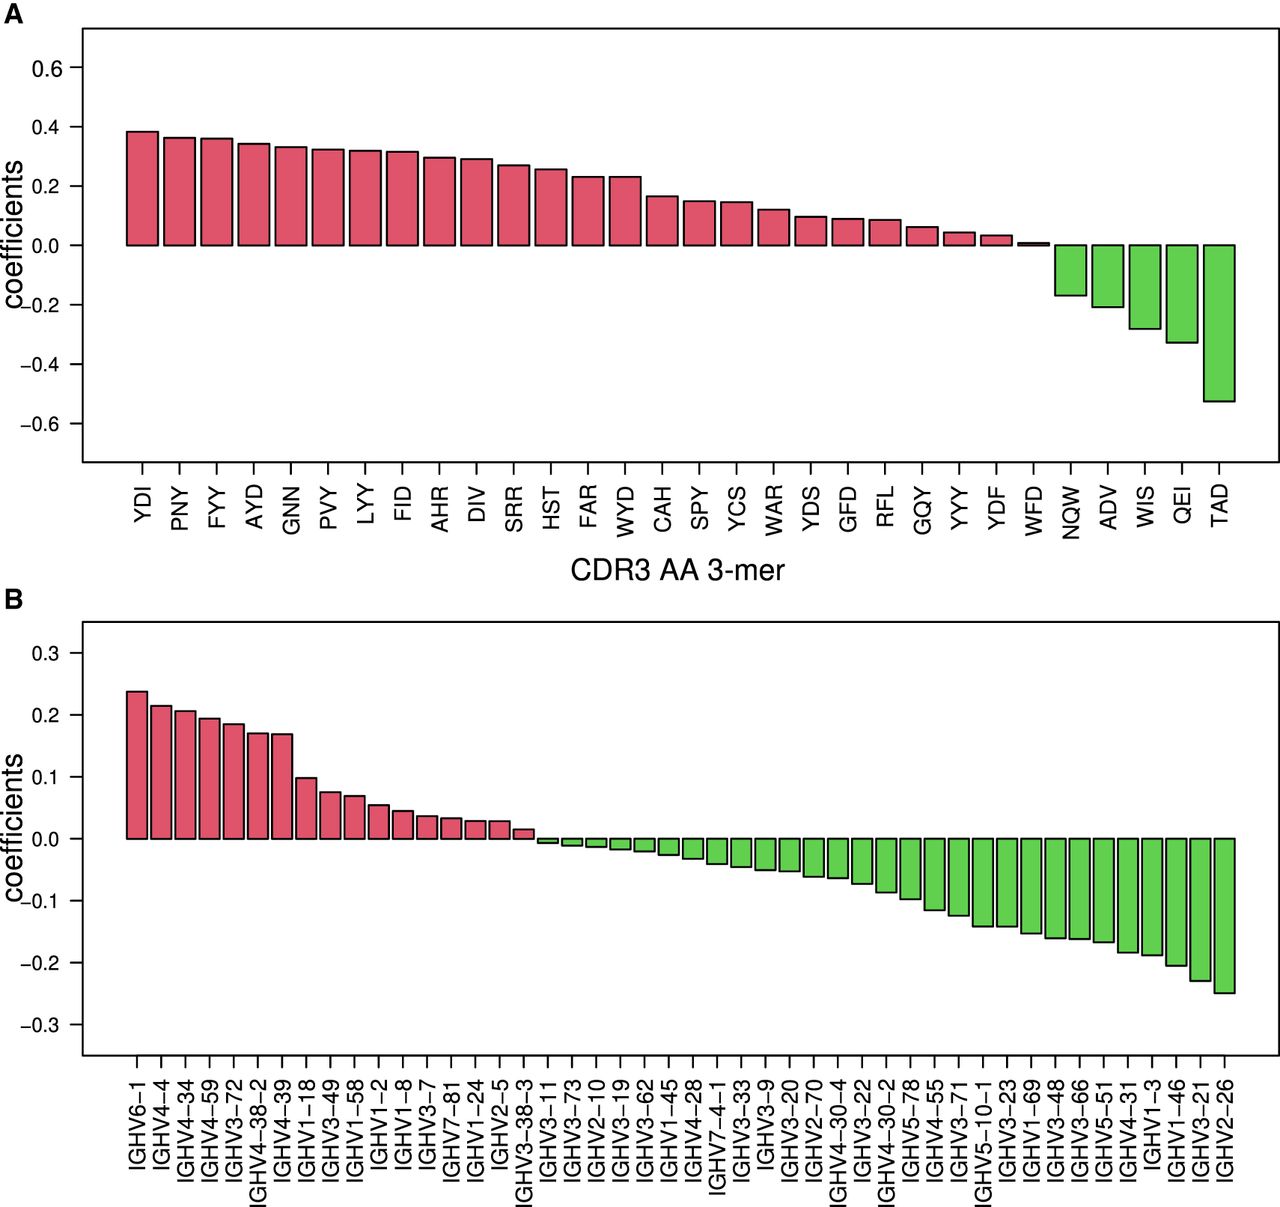
Figure 5.
Top-ranked BCR repertoire–level features for RNA-blood CD stratification. (A) Bar graph showing the coefficients that were calculated on the RNA-blood data set with 3-mers of CDR3's AA. In red are coefficients in favor of CD; in green, coefficients against CD. (B) Bar graph showing the coefficients that were calculated on the whole RNA-blood data set with V gene usage. In red are coefficients in favor of CD; in green, coefficients against CD.