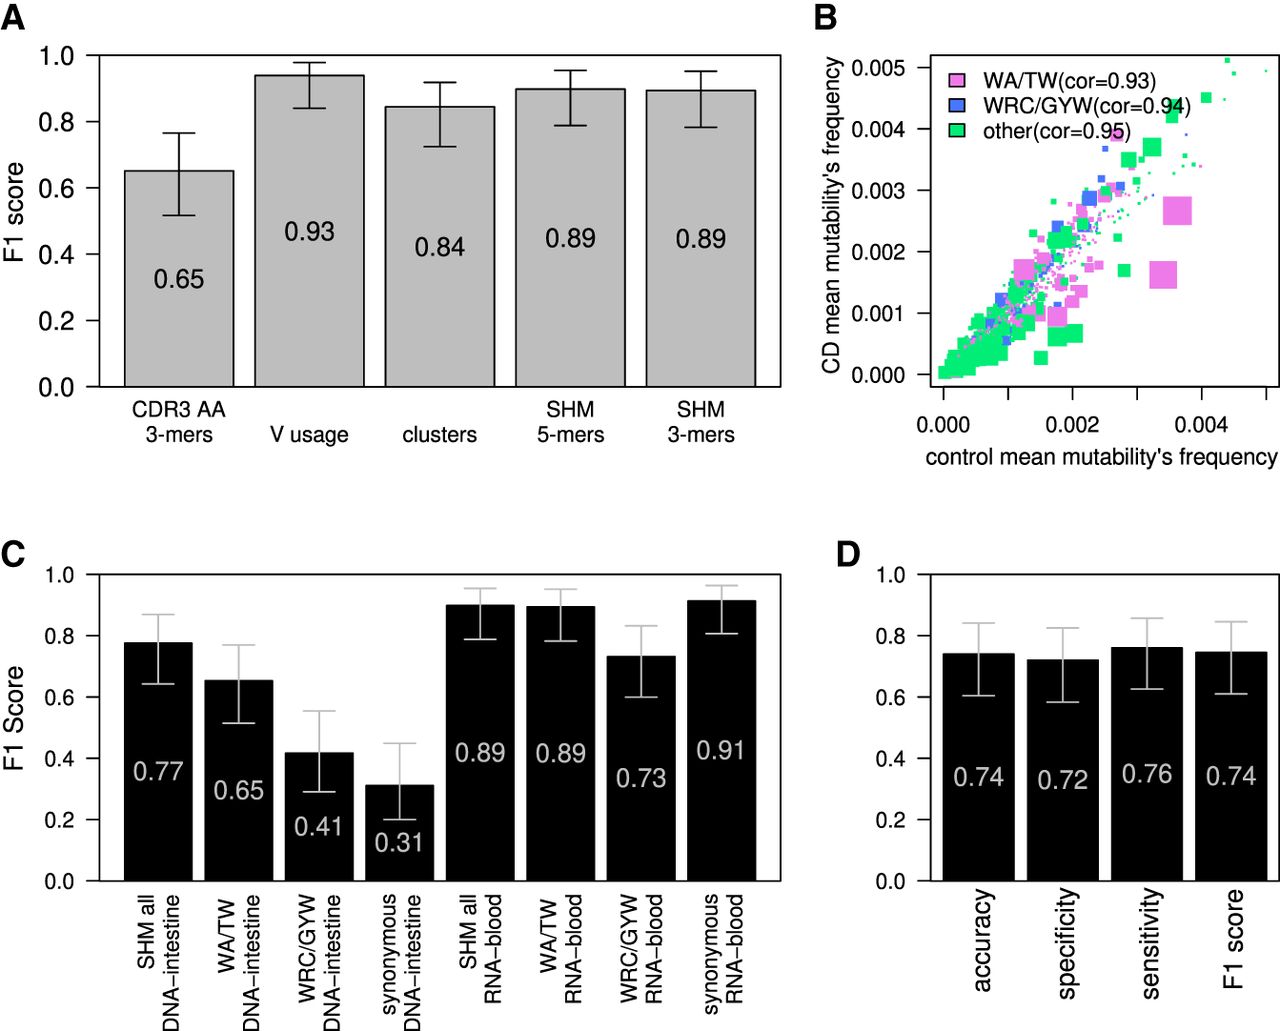
CD classification by blood BCR sequencing. (A) F1 score calculated for the ML algorithm used to classify CD; estimations were made using the leave-one-out cross-validation method. Algorithm was trained on frequencies of 3-mers of CDR3's AA, V gene usage, clusters (same V and J genes and CDR3 length), or frequencies of the normalized DNA 5-mers/3-mers SHM model. Error bars show the confidential interval of 95% as calculated using binomial distribution. (B) Scatter plot showing mean frequencies of each normalized 5-mers mutability in controls and individuals with CD. The color of each dot represents whether it is part of one of two SHM hotspots (purple for the WA/TW hotspot, blue for the WRC/GYW hotspot, and green for the rest). The size of the dot is −Log(P-value) of differences between CD and the controls. Spearman's correlation between mean frequencies of the controls and individuals with CD for each group is shown. (C) F1 score calculated in the same way as in A. Algorithm was trained on frequencies of all normalized DNA 5-mers SHM model, on only patterns within the WA/TW or WRC/GYW hotspots, or on all sites but using only synonymous mutations for SHM calculations. F1 score was calculated separately for the RNA-blood and the DNA-intestine cohorts. Error bars show the confidential interval of 95% as calculated using binomial distribution. (D) Barplot showing the accuracy, specificity, sensitivity, and F1 score of classification of the tissue cohort based on algorithm that was trained on the RNA-blood cohort. The algorithm used was logistic regression with LASSO and elastic net regularization (GLMNET), which was trained on substitutions from the RNA-blood cohort.