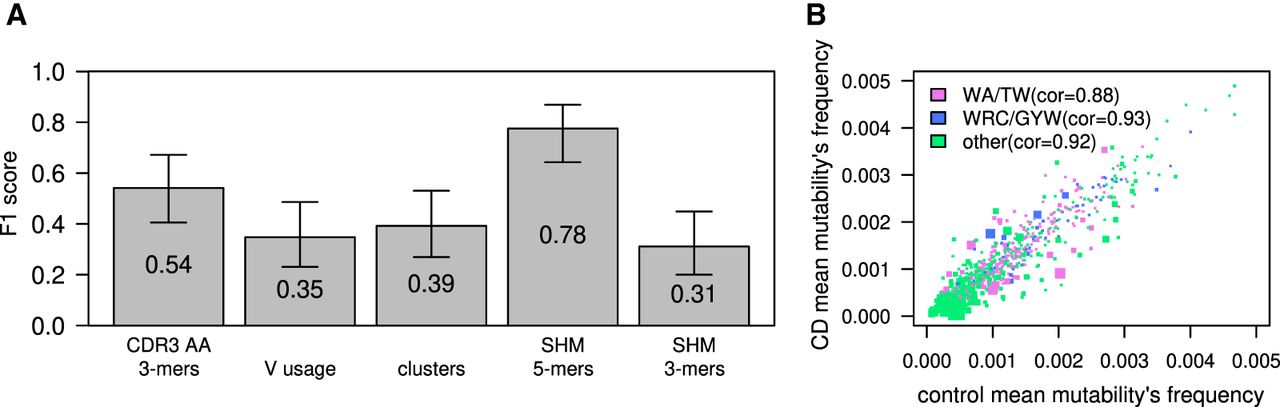
CD classification by tissue BCR sequencing. (A) F1 scores calculated for ML algorithm used to classify CD; estimations were made using a leave-one-out cross-validation method. The model was trained on frequency of 3-mers of CDR3's AA, V gene usage, clusters (same V and J genes and CDR3 length), or frequencies of a normalized DNA 5-mers/3-mers SHM model. Error bars show the confidential interval of 95% as calculated using binomial distribution. (B) Scatter plot showing mean frequency of each normalized 5-mer's mutability in controls and individuals with CD. The color of each dot represents whether it is part of one of two SHM hotspots (purple for the WA/TW hotspot, blue for the WRC/GYW hotspot, and green for the rest). The size of the dot is −Log(P-value) of differences between CD and controls. Spearman's correlation between mean frequencies of controls and individuals with CD for each group is shown.