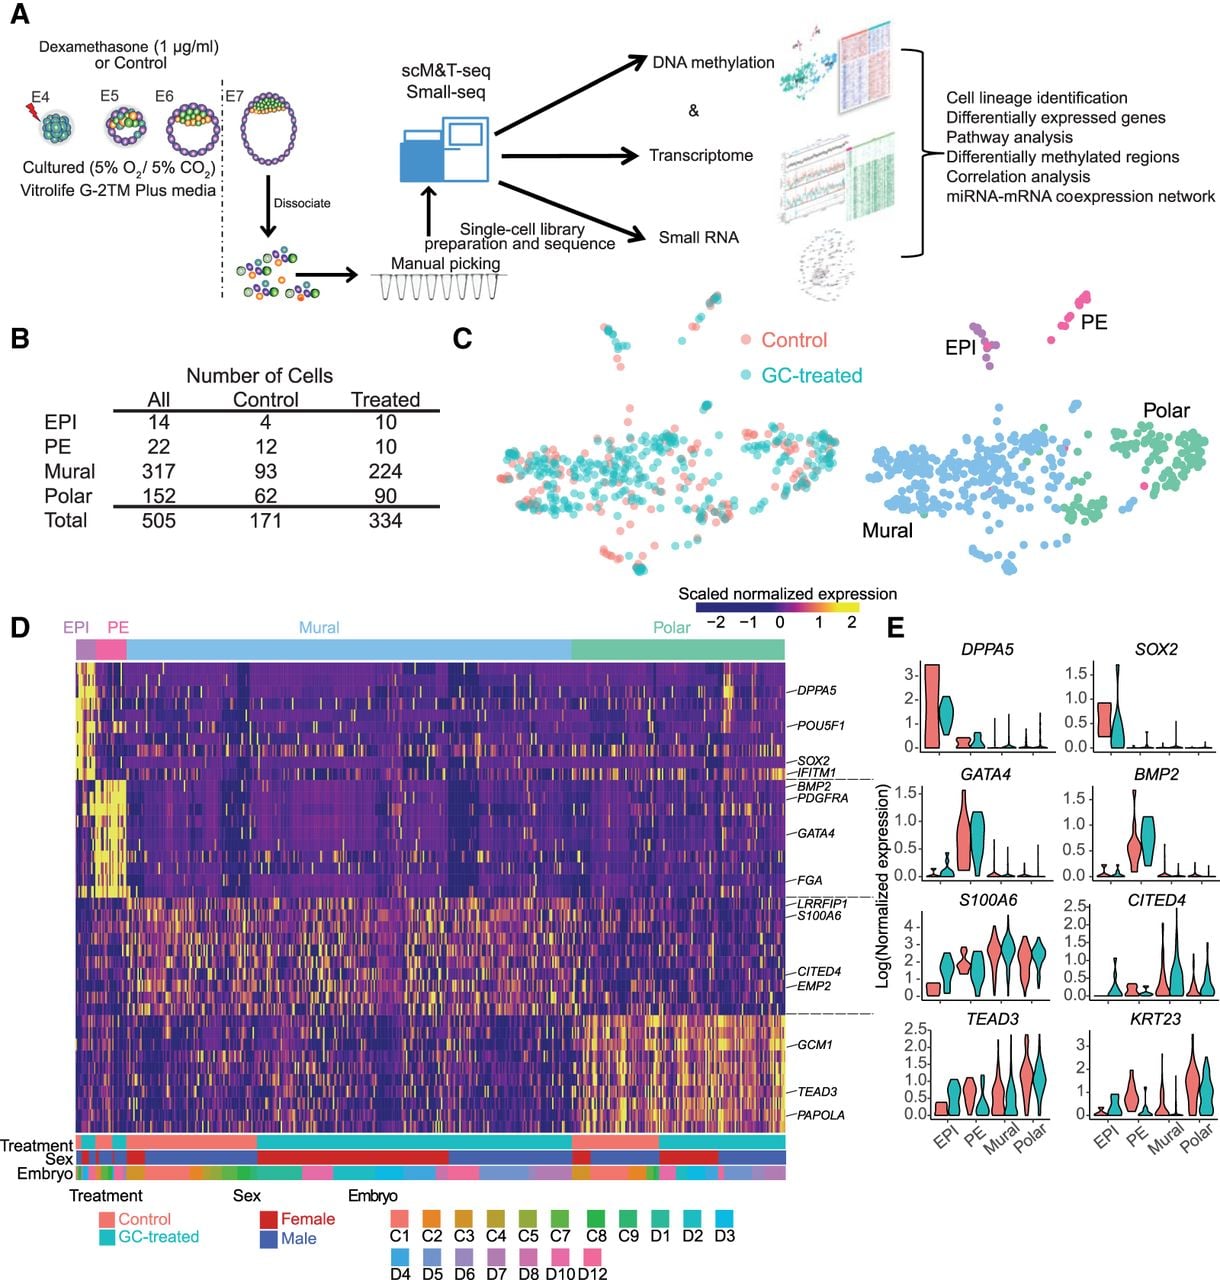
Single-cell analysis reveals cell lineages in control and glucocorticoid-exposed embryos. (A) Process flow diagram of single-cell sequencing data analysis on preimplantation embryos. Single cells were collected from in vitro cultured embryos on E7 (glucocorticoid-treated and control). Libraries were generated using scM&T-seq for the simultaneous measure of transcriptome and methylation and using Small-seq to measure small RNA biotypes. (B) The number of cells retained after quality control for scRNA-seq data. (C) UMAP showing individual cells from all control and glucocorticoid-exposed embryos. Cells are colored by lineages (left) and treatments (right), respectively. (D) Heatmap depicting the expression pattern of the top 10 marker genes (ranked by the “power” values from “roc” test) for each lineage. Names of the known marker genes are listed on the right side. Each row represents individual marker genes; the column represents each cell. The lineage, embryo treatment, embryo sex, and embryo identity are indicated by upper and lower panel annotation, respectively. Color in the heatmap is for the scaled expression data. (E) Violin plots show the expression level distributions of selected marker genes with colors indicating treatment. Lineage marker genes for each cell type are listed in Supplemental Table S2.