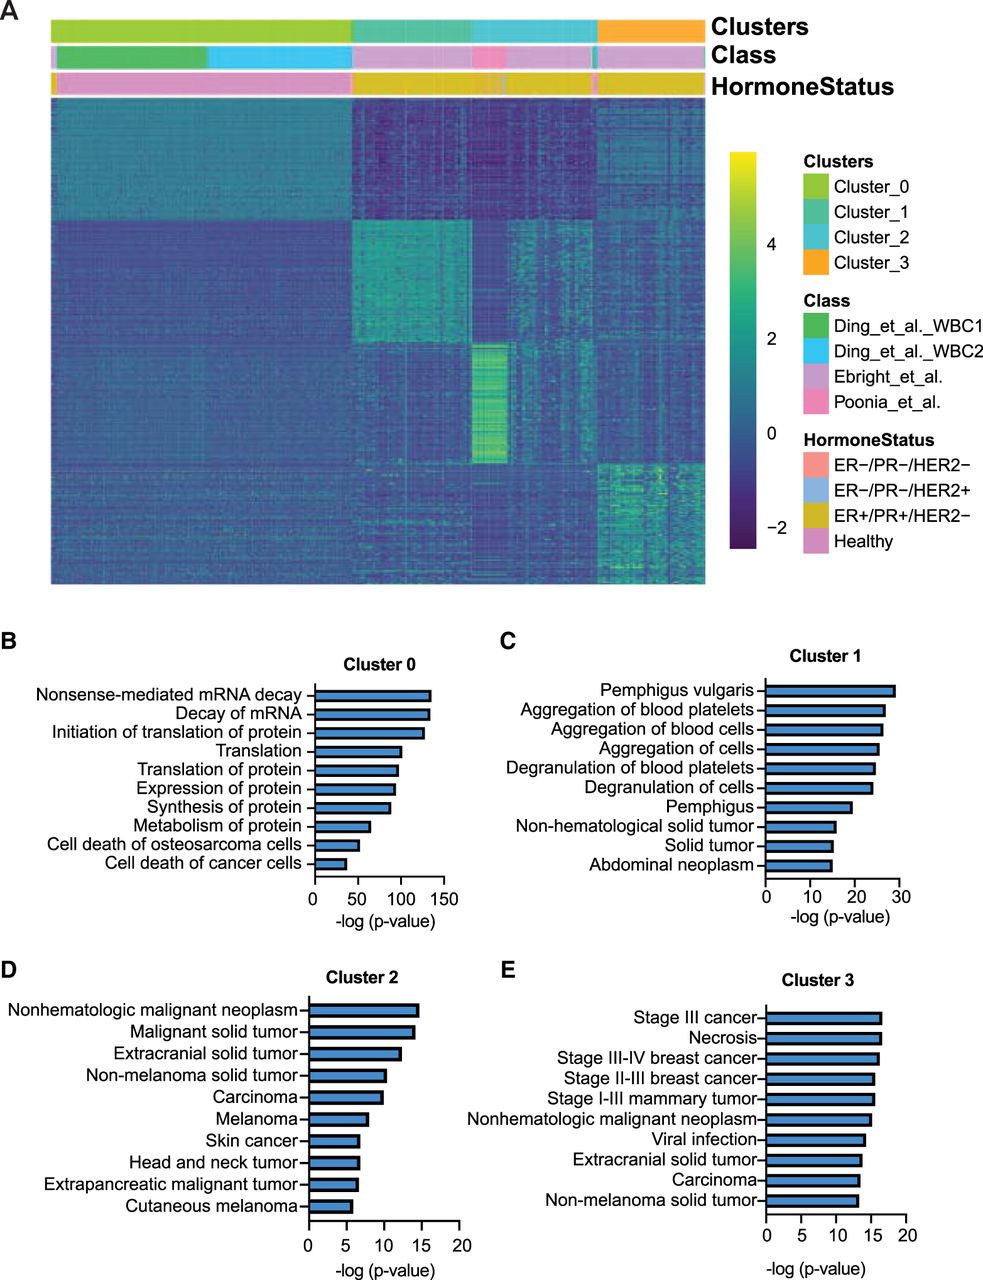
Figure 6.
Functional annotations of the highly enriched CTC-associated genes identified using unCTC. (A) Heatmap depicting the expression of top 200 differentially elevated genes across four clusters detected by unCTC. Color bars indicate cluster identity, source data information, and molecular subcategories. (B–E) Bar plots depicting gene set enrichment using disease and functional annotation modules of IPA. The lists of cluster-specific differentially elevated genes can be found in Supplemental Table S5.